Fig. 10.
Download original image
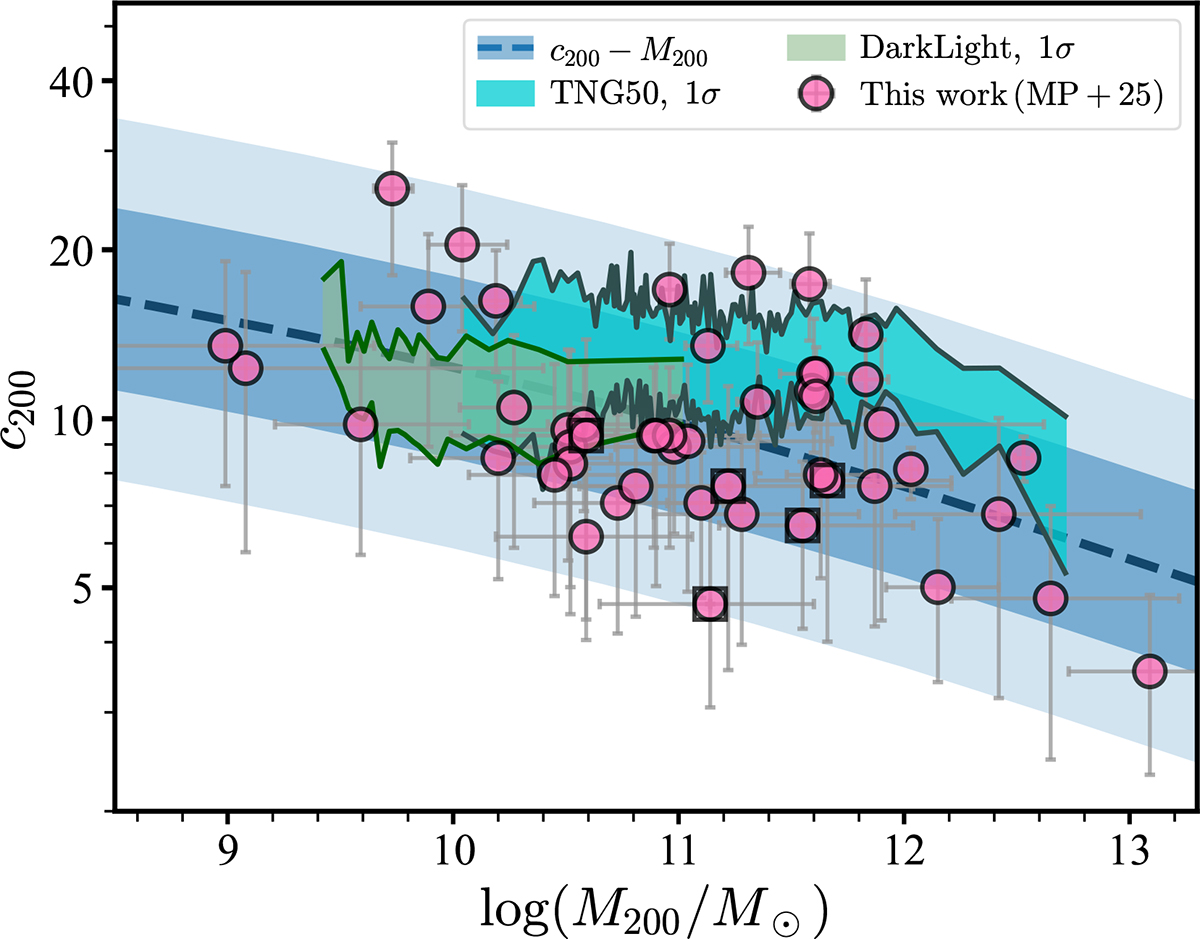
Concentration–mass relation for our galaxy sample (pink markers, squares highlight BDDs). The blue dashed line shows the theoretical relation by DJ19 (imposed as a prior), and the bands show their 1σ and 2σ confidence bands. The 1σ (84th percentiles) distributions of DarkLight (green) and TNG50 (turquoise) simulated galaxies are also included for comparison.
Current usage metrics show cumulative count of Article Views (full-text article views including HTML views, PDF and ePub downloads, according to the available data) and Abstracts Views on Vision4Press platform.
Data correspond to usage on the plateform after 2015. The current usage metrics is available 48-96 hours after online publication and is updated daily on week days.
Initial download of the metrics may take a while.