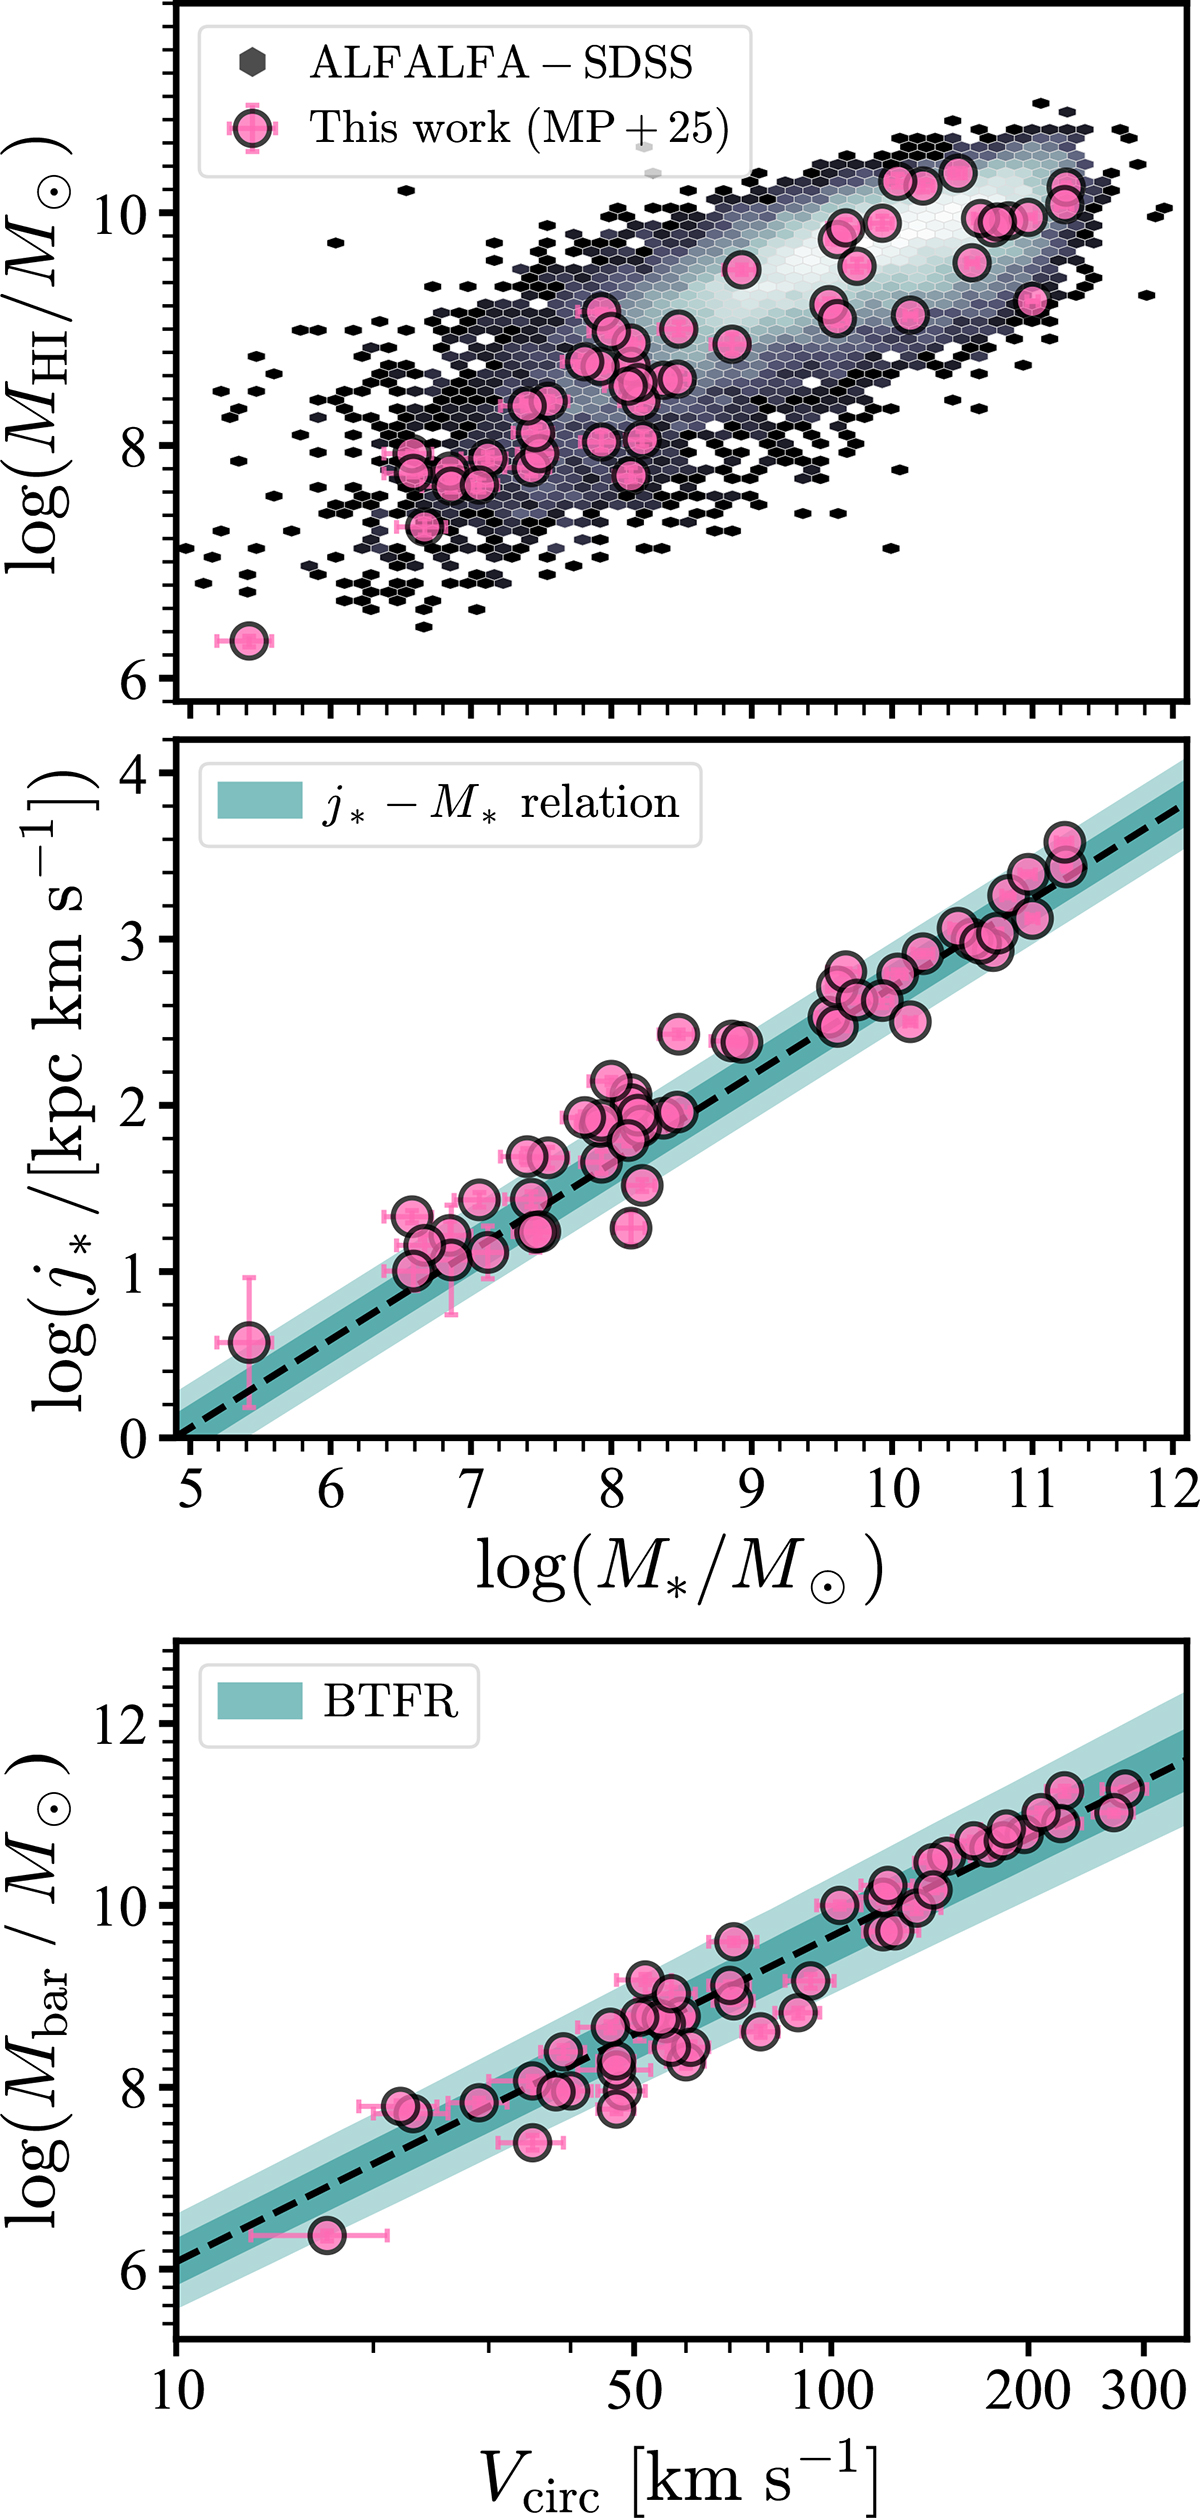
Fig. 1.
Download original image
Overview of our galaxy sample. We place our galaxies in different scaling relations. Top: Stellar mass vs. H I mass plane. The representative ALFALFA-SDSS sample (Durbala et al. 2020) is shown for comparison. Middle: Baryonic Tully-Fisher relation (BTFR; from Di Teodoro et al. 2023). Bottom: Stellar specific angular momentum vs. mass relation (j* − M*; from Mancera Piña et al. 2021b). In the top panel, the colour scale increases logarithmically with the density of the data counts. The shaded bands in the middle and top panels correspond to 1σ and 2σ from the best-fitting relations (black dashed lines).
Current usage metrics show cumulative count of Article Views (full-text article views including HTML views, PDF and ePub downloads, according to the available data) and Abstracts Views on Vision4Press platform.
Data correspond to usage on the plateform after 2015. The current usage metrics is available 48-96 hours after online publication and is updated daily on week days.
Initial download of the metrics may take a while.