Open Access
Fig. 6.
Download original image
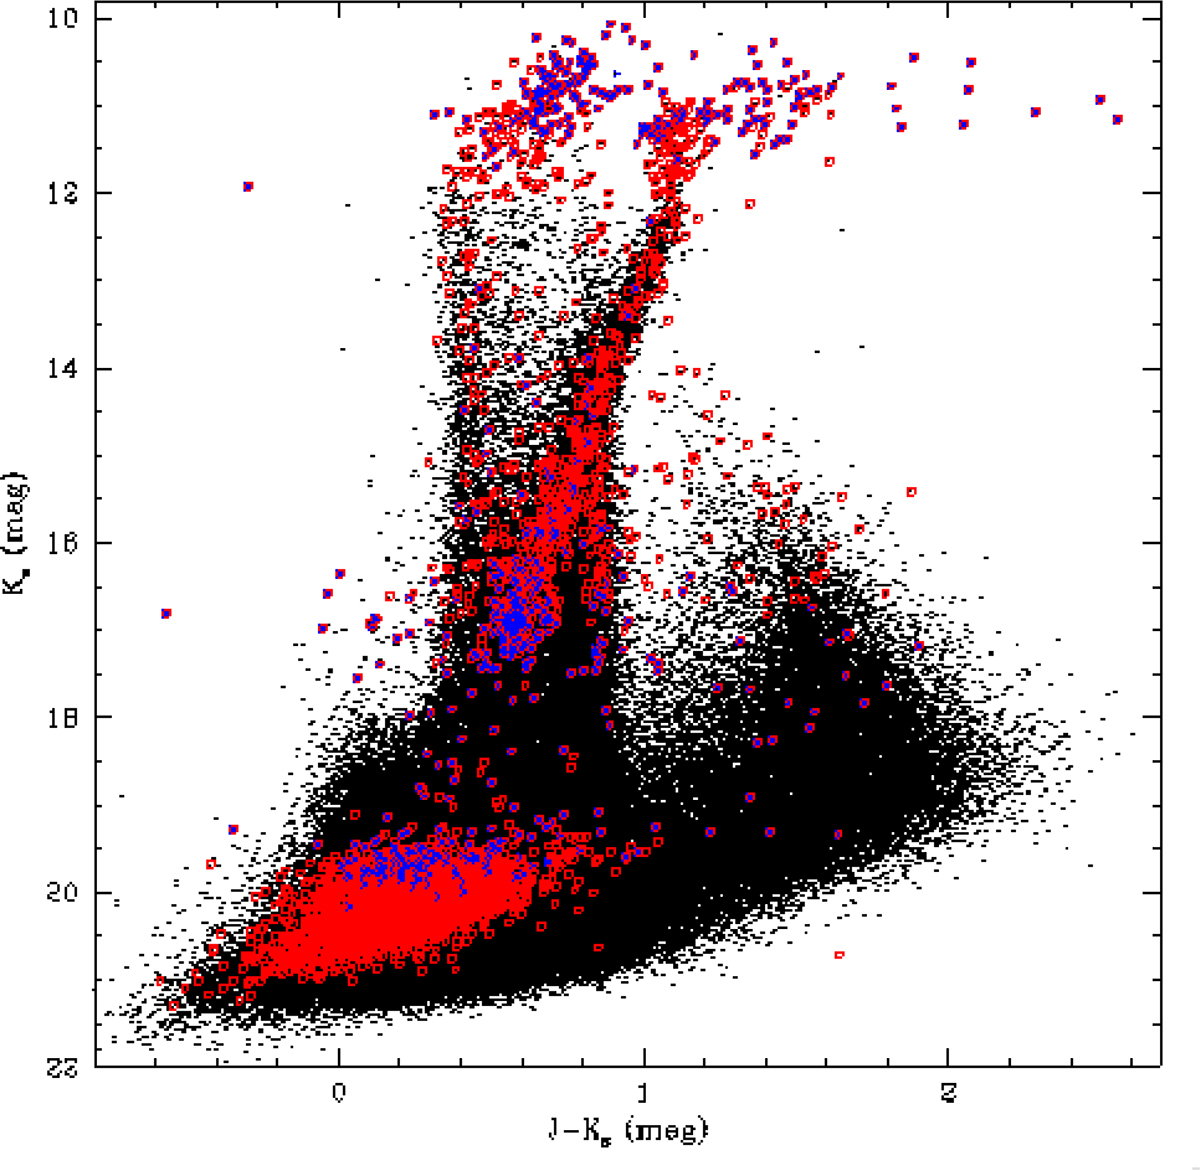
Distribution of VMC sources from tile LMC 3_3 in the colour–magnitude diagram Ks, J−Ks with sources flagged as variable (4275) highlighted in red. Among them 524 (blue) are detected in three bands, have rms < 1 and amplitude, defined as the difference between the maximum and minimum Ks magnitudes, <0.4 mag.
Current usage metrics show cumulative count of Article Views (full-text article views including HTML views, PDF and ePub downloads, according to the available data) and Abstracts Views on Vision4Press platform.
Data correspond to usage on the plateform after 2015. The current usage metrics is available 48-96 hours after online publication and is updated daily on week days.
Initial download of the metrics may take a while.