Fig. 4.
Download original image
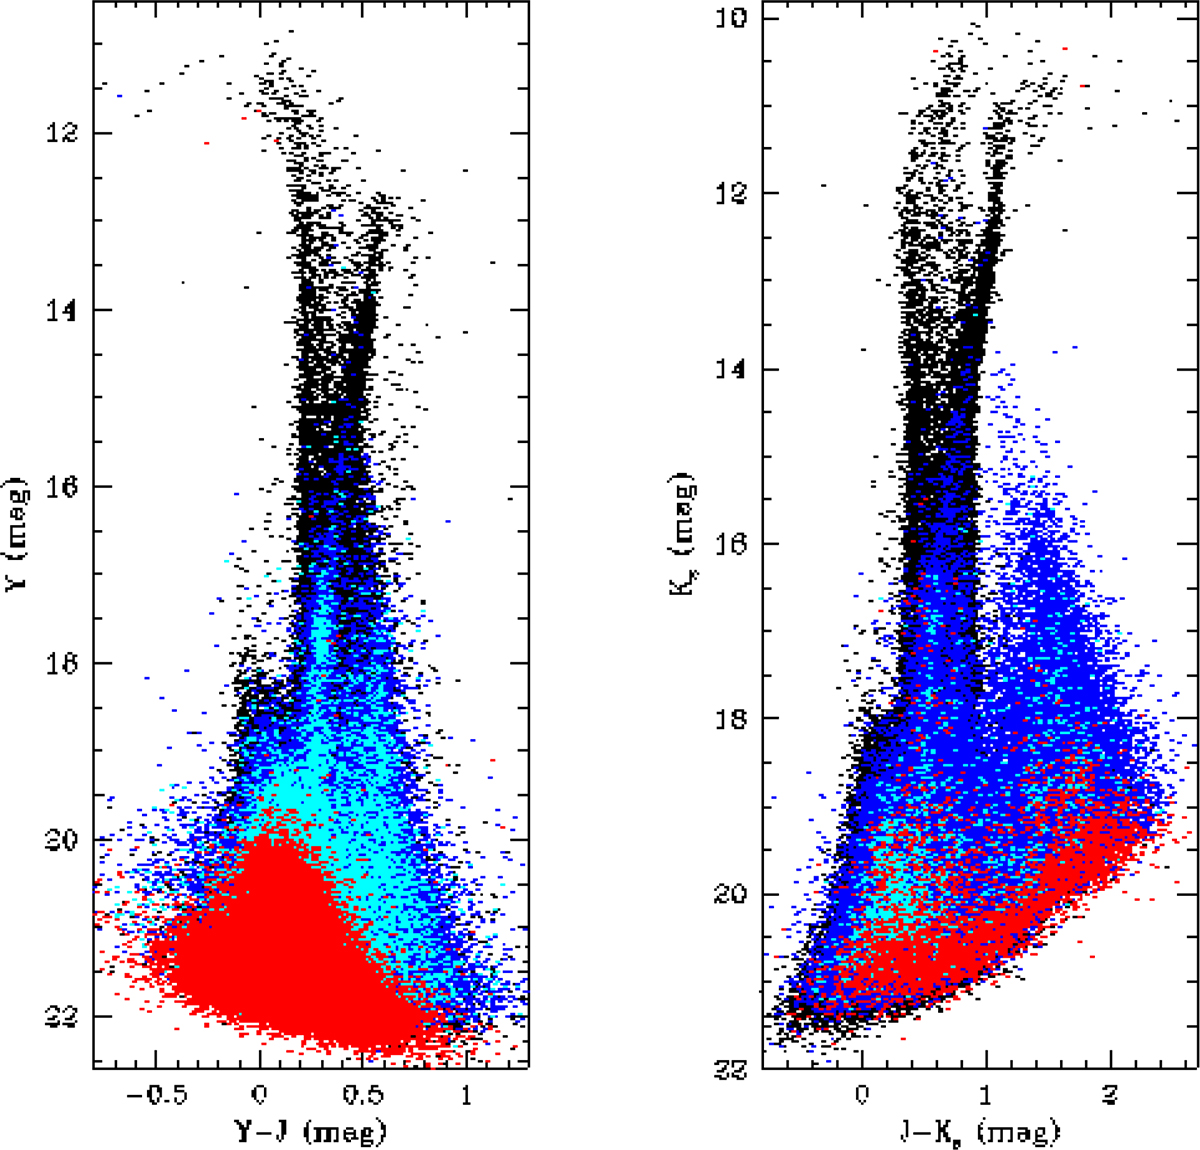
Distribution of the VMC sources from tile LMC 3_3 in the colour–magnitude diagrams (Y, Y−J) on the left and (Ks, J−Ks) on the right. Different types of detections are colour-coded as follows. Sources with a stellar or a galaxy profile which are detected in three bands are shown in black and blue, respectively. Similar sources detected only in two bands are shown in red and turquoise.
Current usage metrics show cumulative count of Article Views (full-text article views including HTML views, PDF and ePub downloads, according to the available data) and Abstracts Views on Vision4Press platform.
Data correspond to usage on the plateform after 2015. The current usage metrics is available 48-96 hours after online publication and is updated daily on week days.
Initial download of the metrics may take a while.