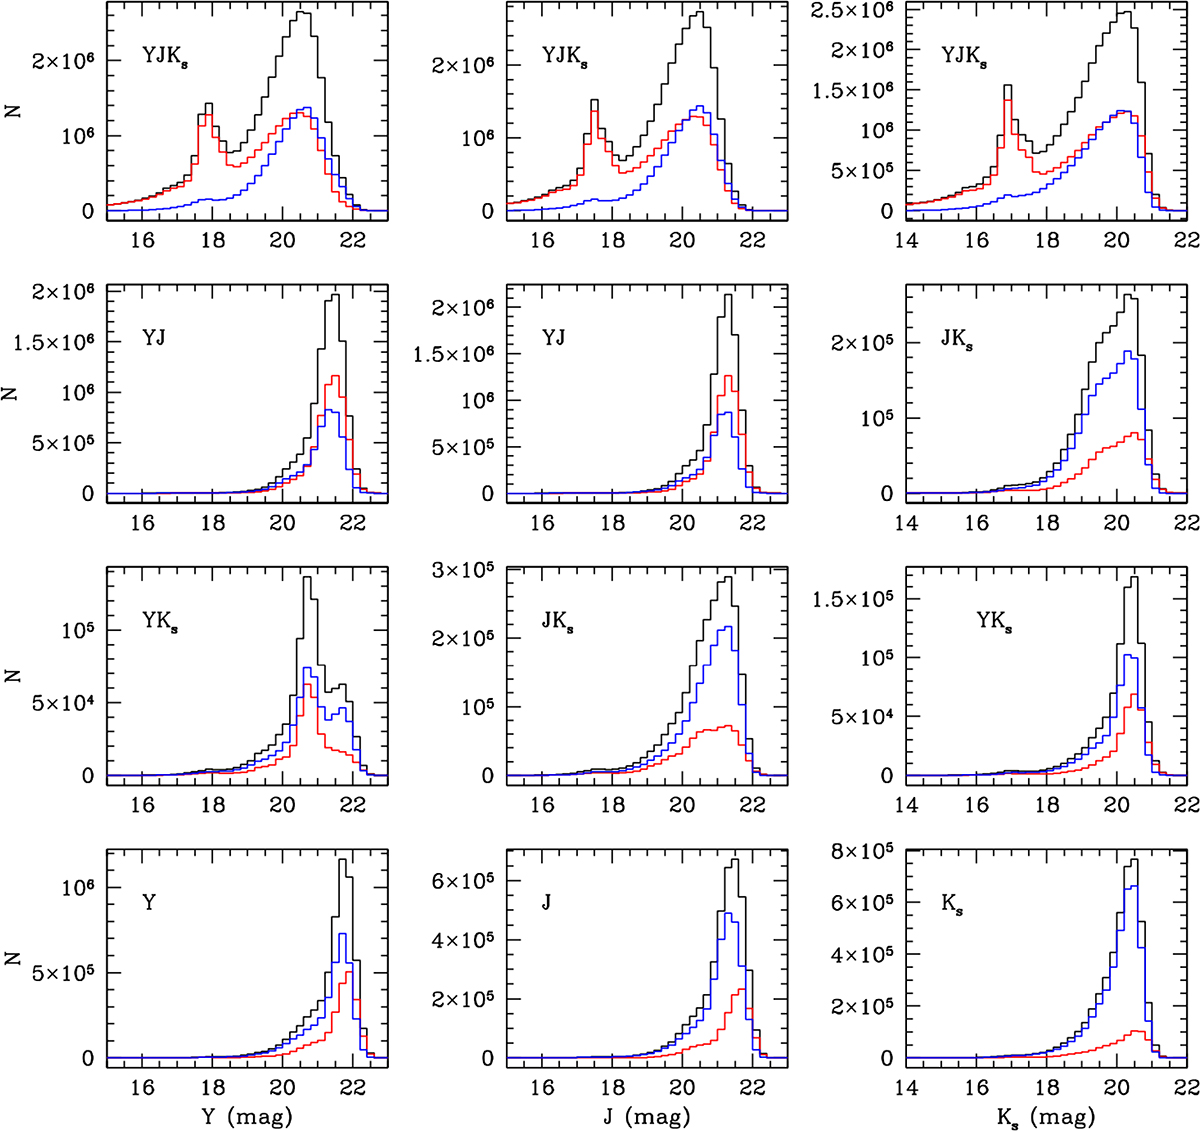
Fig. 2.
Download original image
Apparent luminosity function in 0.2 mag bins, for the entire catalogue, with detections in multiple (two or three) and single filters. Each column corresponds to a different band and each line corresponds to a different combination of detections, as indicated within each panel. Sources with a stellar profile are shown in red and sources with a galaxy profile are shown in blue whereas their total is shown in black.
Current usage metrics show cumulative count of Article Views (full-text article views including HTML views, PDF and ePub downloads, according to the available data) and Abstracts Views on Vision4Press platform.
Data correspond to usage on the plateform after 2015. The current usage metrics is available 48-96 hours after online publication and is updated daily on week days.
Initial download of the metrics may take a while.