Fig. 1.
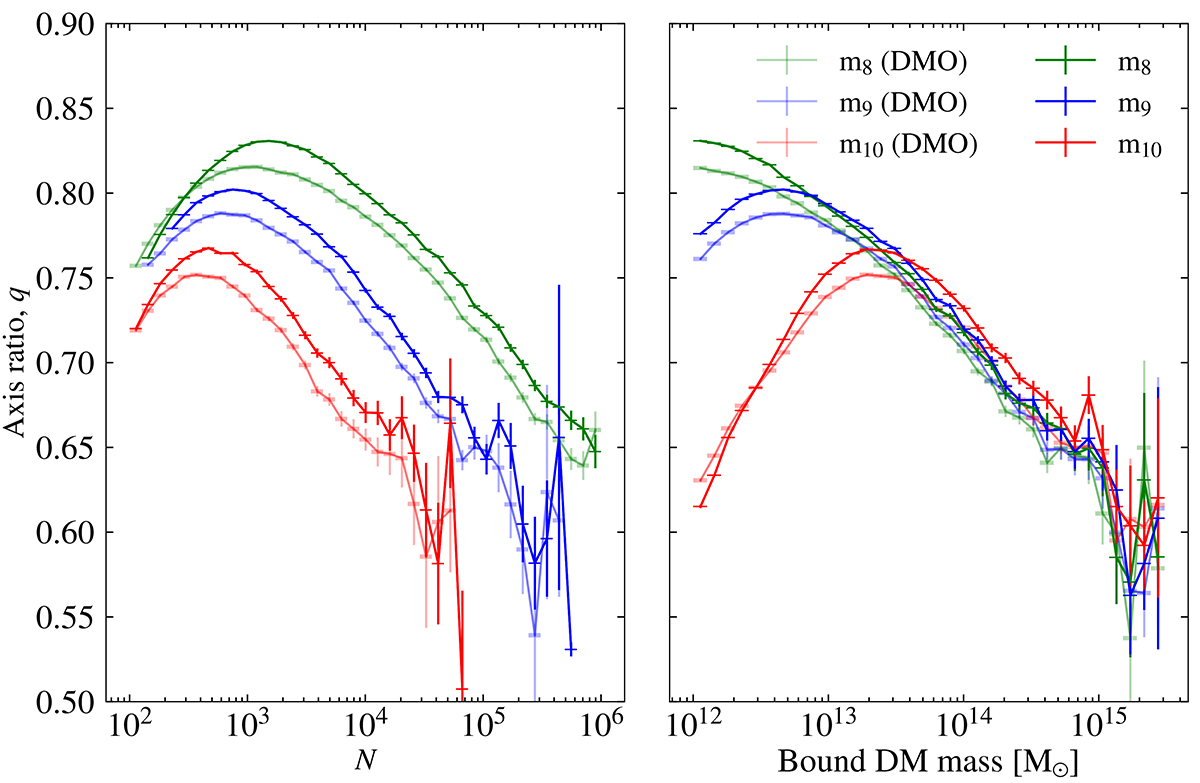
Download original image
Left: Variation of the average 3D axis ratio, q=b/a, with bound dark matter particle number for the three resolutions for both the HYDRO (solid) and DMO (transparent) runs. Right: The variation of the average 3D axis ratio with bound halo dark matter mass for the three resolutions for both the HYDRO and DMO runs. The different colours indicate the different simulation resolutions, with m8 being the highest resolution. There is a downturn at below 103 particles (which corresponds to a different mass for each resolution as is clear from the right panel) which suggests its origin is numerical rather than physical. The DM masses for the HYDRO runs have been corrected by a factor of Ωm/(Ωm−Ωb). The errors are calculated for each particle number (or mass) bin by taking the standard deviation in each bin and dividing by the square root of the number of objects in that bin.
Current usage metrics show cumulative count of Article Views (full-text article views including HTML views, PDF and ePub downloads, according to the available data) and Abstracts Views on Vision4Press platform.
Data correspond to usage on the plateform after 2015. The current usage metrics is available 48-96 hours after online publication and is updated daily on week days.
Initial download of the metrics may take a while.