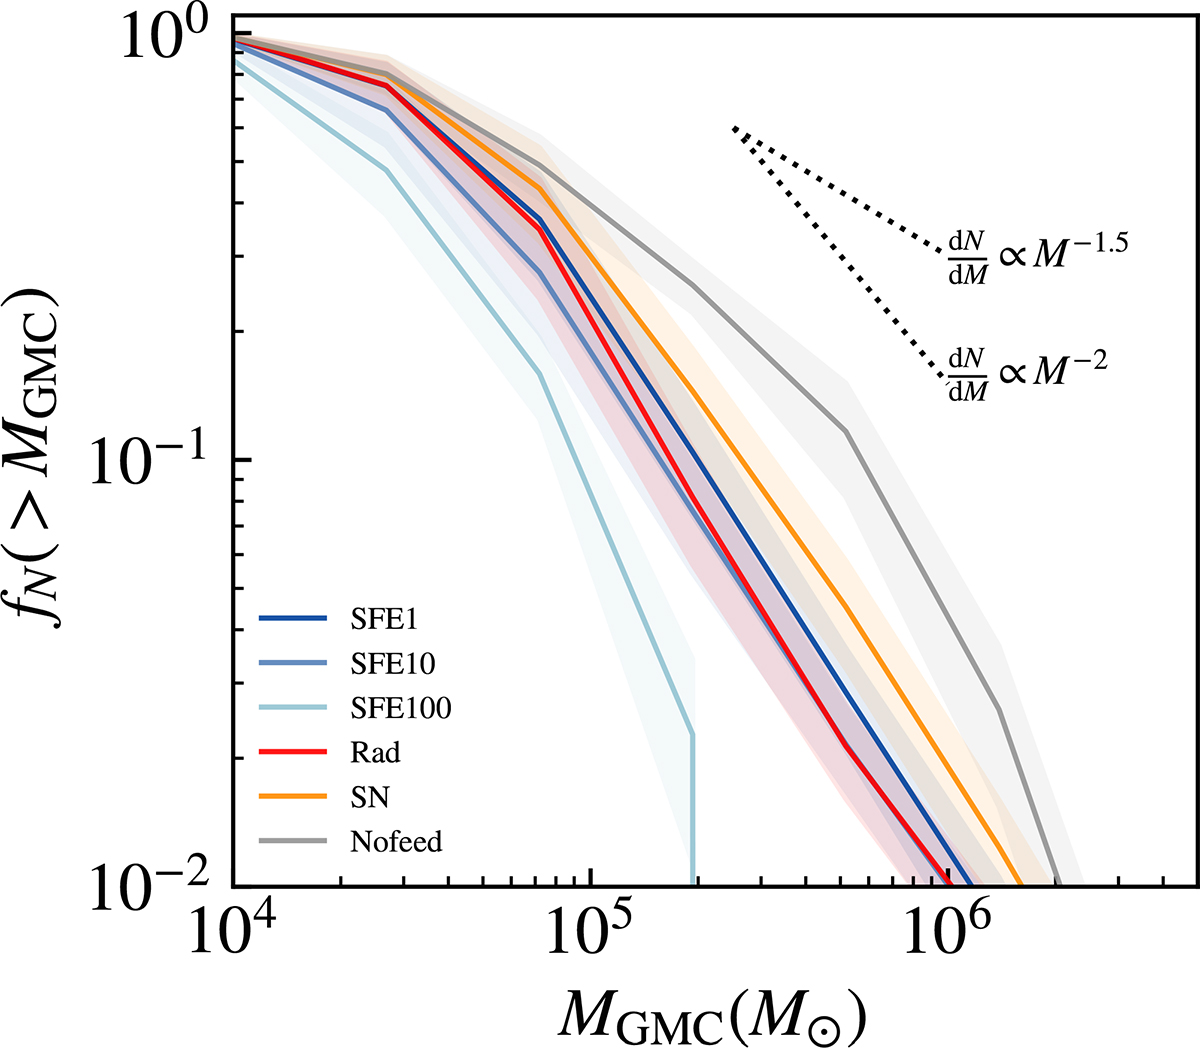
Fig. 2.
Download original image
Cumulative distribution of GMC mass (MGMC) in different model variations: SFE1 (royal blue), SFE10 (sky blue), SFE100 (light blue), Rad (red), SN (dark orange), and Nofeed (gray). Each solid line gives the median value of the cumulative mass function and the shaded areas enclose the 25%−75% percentile across the time span 0.4−1 Gyr. We also show the slopes of 1.5 and 2 as dashed black lines for reference.
Current usage metrics show cumulative count of Article Views (full-text article views including HTML views, PDF and ePub downloads, according to the available data) and Abstracts Views on Vision4Press platform.
Data correspond to usage on the plateform after 2015. The current usage metrics is available 48-96 hours after online publication and is updated daily on week days.
Initial download of the metrics may take a while.