Fig. 3
Download original image
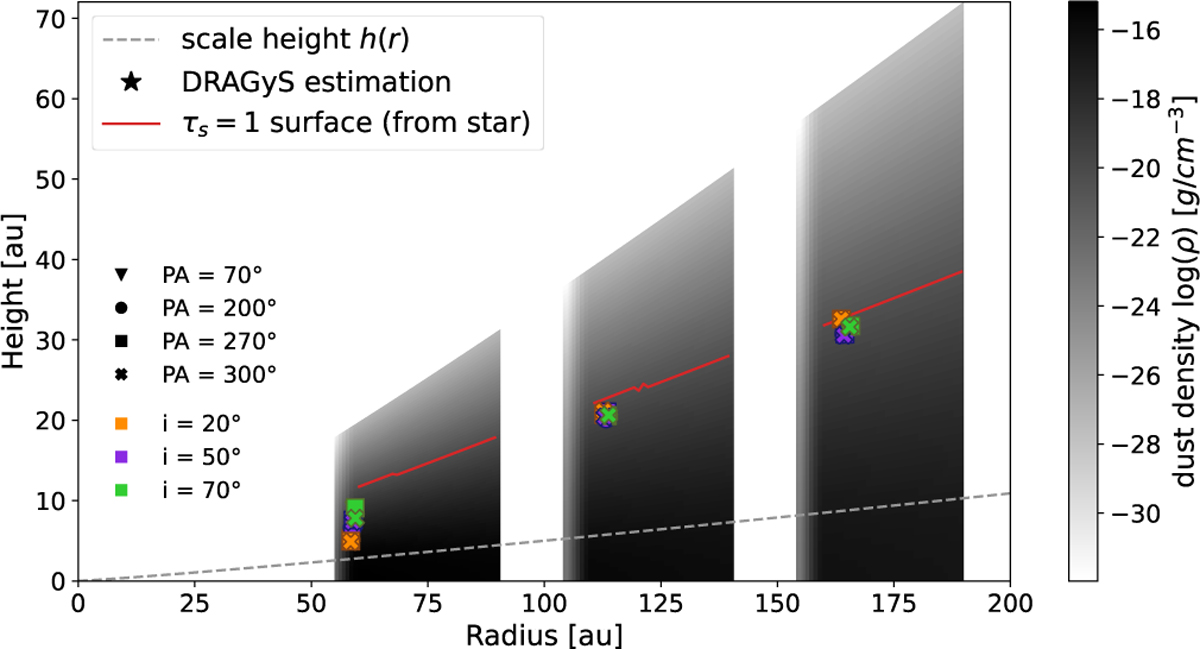
Comparison of estimated scattering height estimation with the τs = 1 surface integrated from the star (red) for each ring (respectively between 60–90 au, 110–140 au, and 160–190 au). We overplot the scattering height surface estimated using DRAGyS, for each inclination and position angle, in different colors and markers. We have added the dust density map in the background and, we also plot the gas pressure scale height with a dashed gray curve, using the input MCFOST parameters.
Current usage metrics show cumulative count of Article Views (full-text article views including HTML views, PDF and ePub downloads, according to the available data) and Abstracts Views on Vision4Press platform.
Data correspond to usage on the plateform after 2015. The current usage metrics is available 48-96 hours after online publication and is updated daily on week days.
Initial download of the metrics may take a while.