Fig. D.1
Download original image
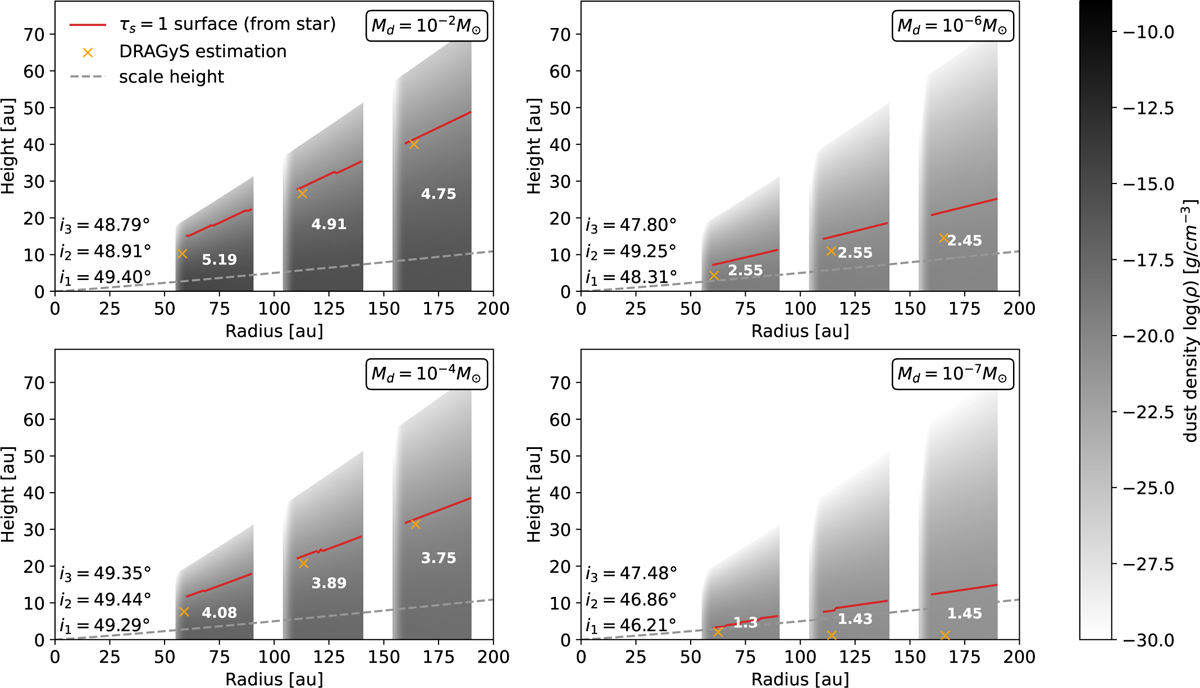
Scattering surface estimation hs using DRAGyS (orange cross), compared to the τs = 1 surface from the star (red curves) for different dust masses from Md = 10−2, 10−4, 10−6 and 10−7 M⊙ for each ring (respectively between 60-90 au, 110-140 au, and 160-190 au). As in section 3.2, we add the dust density map in the background, and we overplot the input gas pressure scale height as a gray dashed curve. The ratio (τs = 1 surface / pressure scale height) is indicated in white for each ring.
Current usage metrics show cumulative count of Article Views (full-text article views including HTML views, PDF and ePub downloads, according to the available data) and Abstracts Views on Vision4Press platform.
Data correspond to usage on the plateform after 2015. The current usage metrics is available 48-96 hours after online publication and is updated daily on week days.
Initial download of the metrics may take a while.