Fig. 6
Download original image
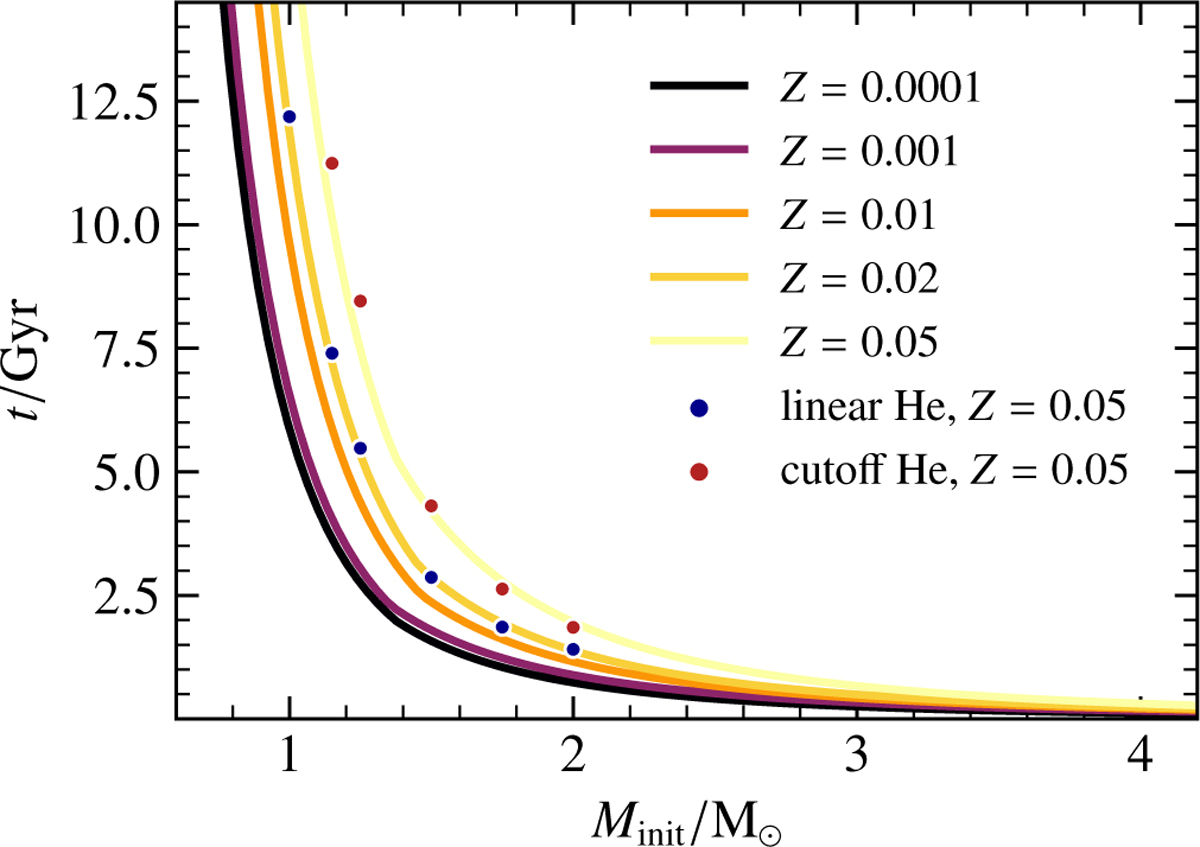
Lifetime function of stars until they reach the post-AGB phase as a function of their initial mass. The lines are the fit relations to the models of Miller Bertolami (2016) with original metallicities of Z = 0.0001, 0.001, 0.01, and 0.02, as in Fig. 1. Here, the extrapolation of these fits to Z = 0.05 is also shown. The points are the results of newly run models following the procedure of Miller Bertolami (2016) for Z = 0.05, and the lines are the fit relations to those data points. The linear helium abundance is at Y = 0.345 and the cutoff helium abundance at Y = 0.285. The thick lines are at the same metallicities as the ones from the original models (Z = 0.0001, 0.001, 0.01, and 0.02) and the thin lines are at Z = 0.00001, 0.0003, 0.003, and 0.014, where the last three values are the logarithmic midpoints of the original metallicities.
Current usage metrics show cumulative count of Article Views (full-text article views including HTML views, PDF and ePub downloads, according to the available data) and Abstracts Views on Vision4Press platform.
Data correspond to usage on the plateform after 2015. The current usage metrics is available 48-96 hours after online publication and is updated daily on week days.
Initial download of the metrics may take a while.