Open Access
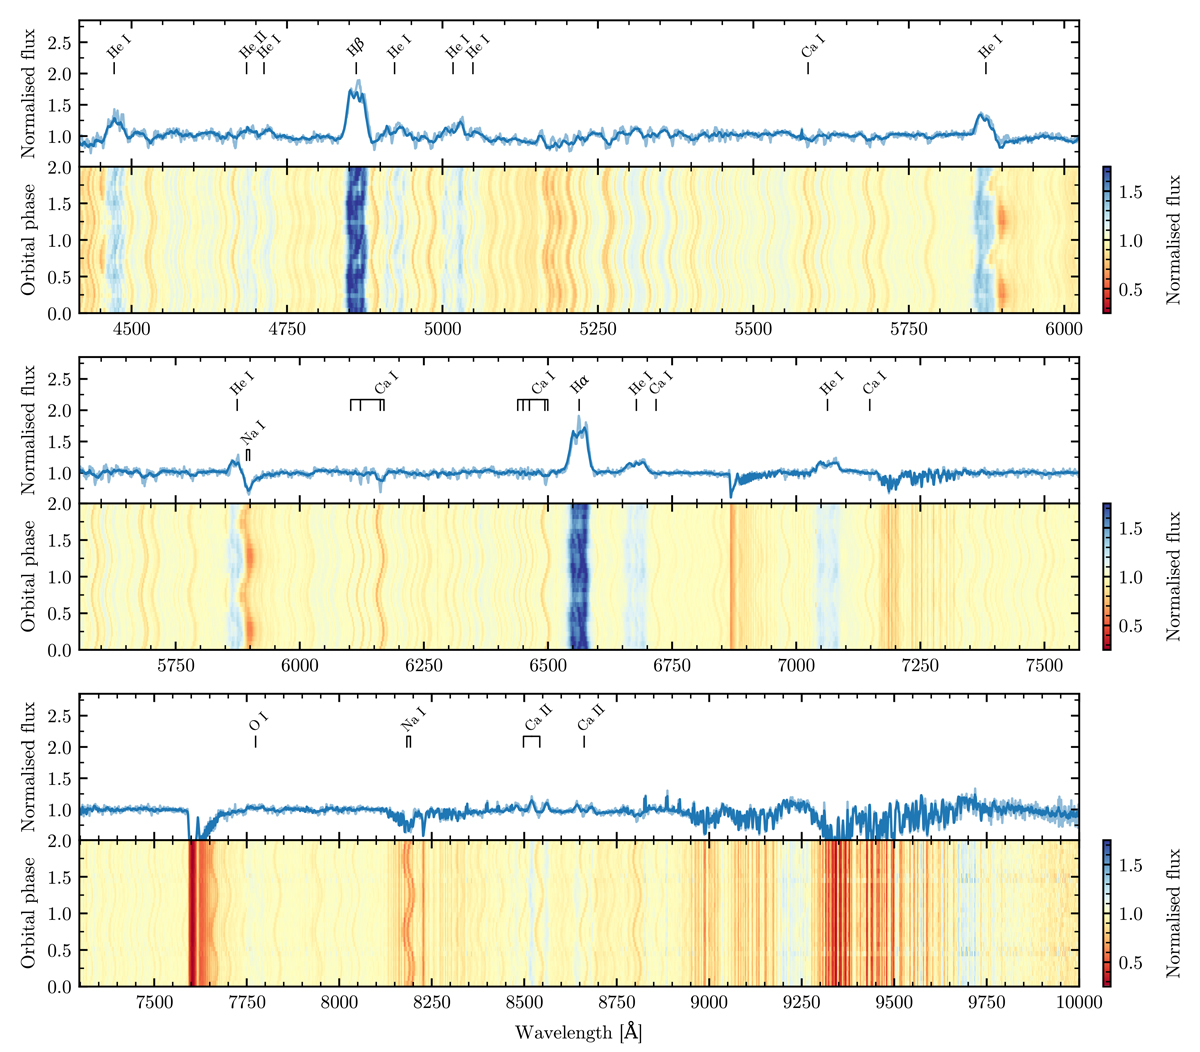
Fig. 7.
Download original image
Spectra of EI Psc obtained at GTC with grism R2500V (top panels), R2500R (middle panels), and R2500I (bottom panels). The upper panels show averaged spectra in blue and a single spectrum in light blue, single spectra were obtained during the orbital phase φ ≐ 0.0. The lower panels show trailed spectra.
Current usage metrics show cumulative count of Article Views (full-text article views including HTML views, PDF and ePub downloads, according to the available data) and Abstracts Views on Vision4Press platform.
Data correspond to usage on the plateform after 2015. The current usage metrics is available 48-96 hours after online publication and is updated daily on week days.
Initial download of the metrics may take a while.