Open Access
Fig. 18.
Download original image
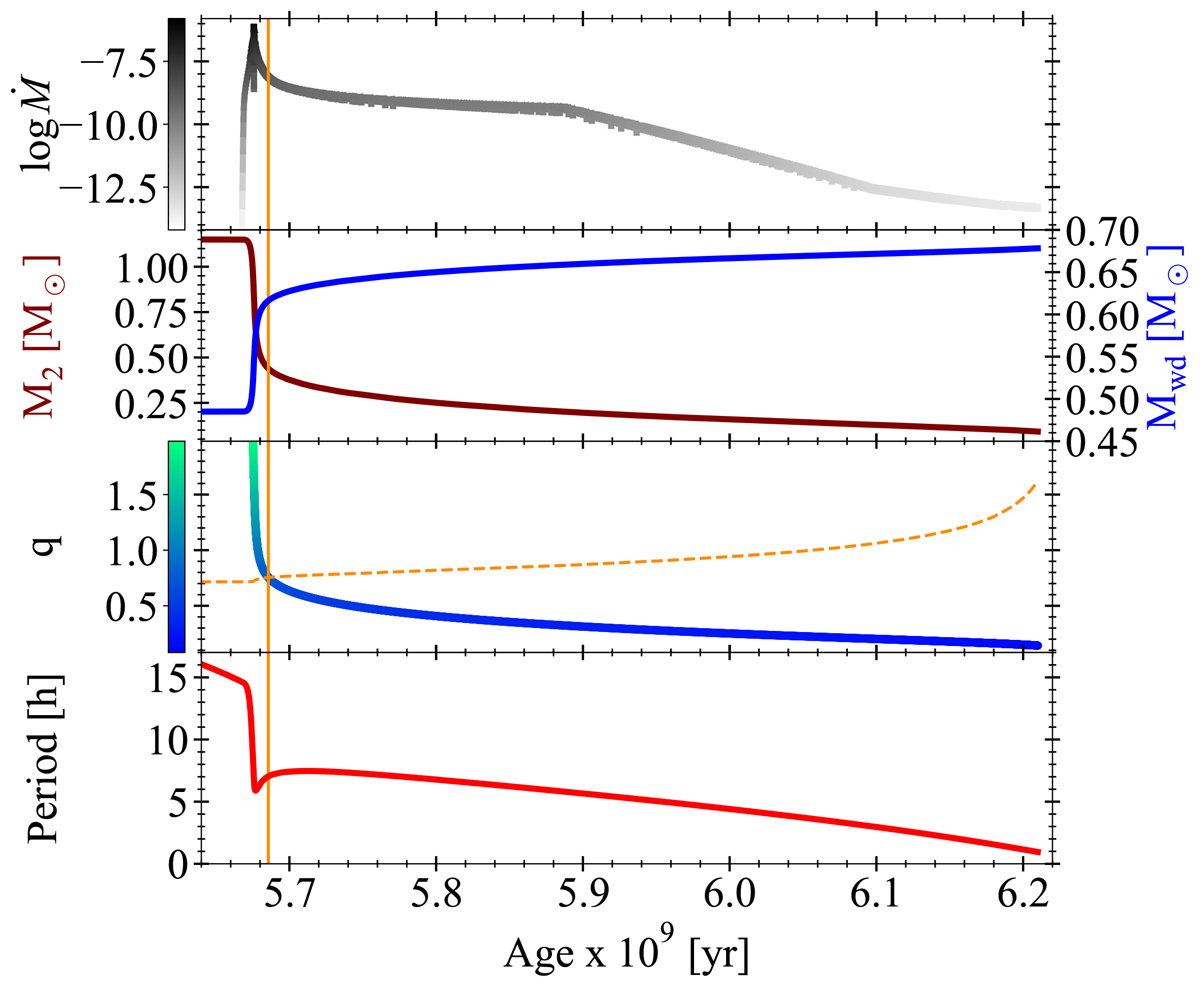
Evolution of parameters of the best MESA model of EI Psc with the system age. The mass transfer rate Ṁ is given in M⊙ year−1 unit. The dashed orange line shows the critical mass ratio (see the text). The solid orange line corresponds to the age of the system, after which the mass transfer becomes stable.
Current usage metrics show cumulative count of Article Views (full-text article views including HTML views, PDF and ePub downloads, according to the available data) and Abstracts Views on Vision4Press platform.
Data correspond to usage on the plateform after 2015. The current usage metrics is available 48-96 hours after online publication and is updated daily on week days.
Initial download of the metrics may take a while.