Fig. 1.
Download original image
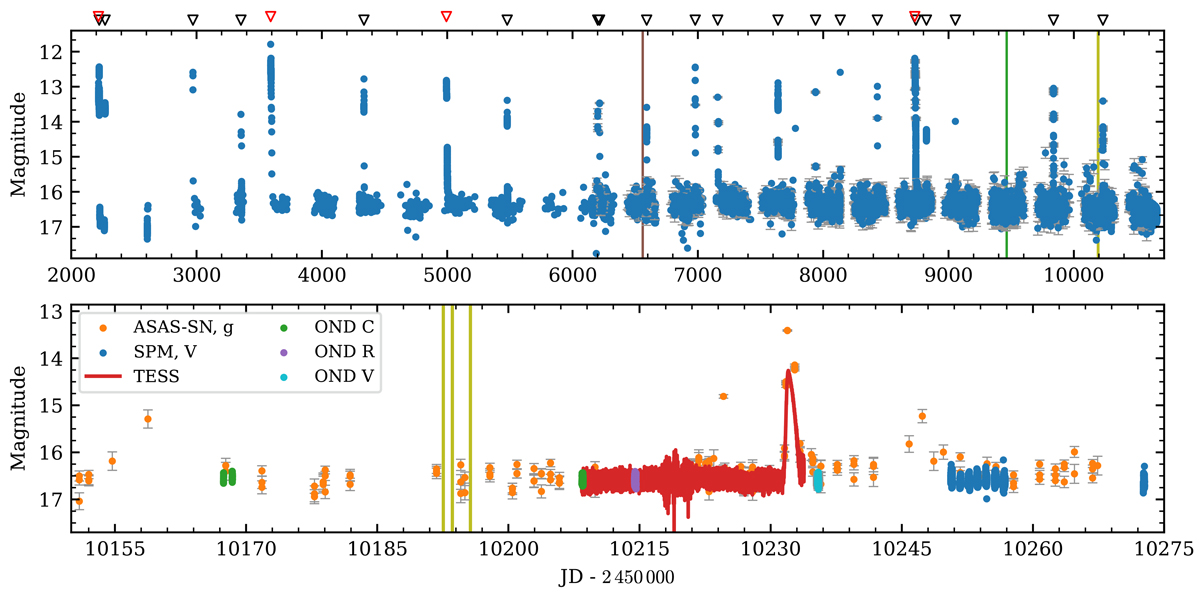
Top: Long-term light curve of EI Psc composed of ASAS-SN, ZTF, Gaia, AAVSO, TESS, SPM, Ondřejov observations, and observations published by Skillman et al. (2002). The vertical lines represent the date of spectral observations of LAMOST (brown), ESO (green), and GTC (yellow). The black and red triangles mark the observed outbursts and superoutbursts, respectively. Bottom: Light curve showing the scheduling of different observations focusing on the time of GTC observations (yellow vertical lines) and SPM observations. The photometric data in both panels were shifted in such a way that the quiescence level would be the same as for the SPM data.
Current usage metrics show cumulative count of Article Views (full-text article views including HTML views, PDF and ePub downloads, according to the available data) and Abstracts Views on Vision4Press platform.
Data correspond to usage on the plateform after 2015. The current usage metrics is available 48-96 hours after online publication and is updated daily on week days.
Initial download of the metrics may take a while.