Fig. 6
Download original image
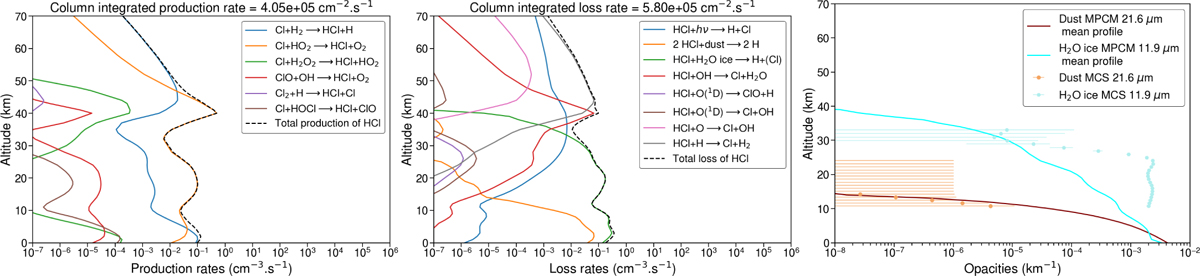
Model production (left) and loss (middle) rates of HCl corresponding to the ACS HCl detection from Fig. 5, where modelled HCl is lower than observed by ACS. The right panel shows model (solid line) and MCS (closed circles) water ice and dust opacity profiles. The MCS data are taken as close as possible in space and time to the ACS MIR HCl observation. Model profiles are averaged over the 5° LS interval containing the observation; standard deviations are omitted here for clarity.
Current usage metrics show cumulative count of Article Views (full-text article views including HTML views, PDF and ePub downloads, according to the available data) and Abstracts Views on Vision4Press platform.
Data correspond to usage on the plateform after 2015. The current usage metrics is available 48-96 hours after online publication and is updated daily on week days.
Initial download of the metrics may take a while.