Fig. 3
Download original image
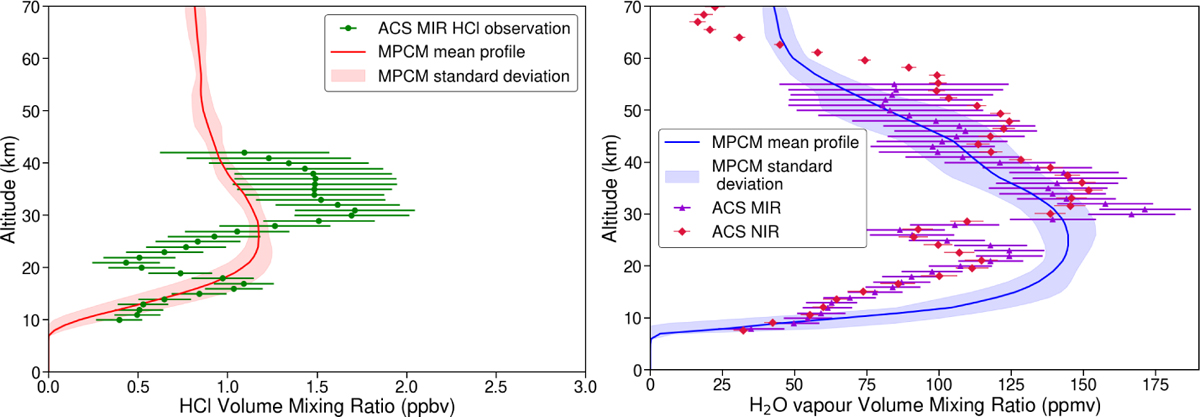
Comparison between model and observed VMRs of HCl (left) and water vapour (right) for a representative case where the modelled HCl VMR profile is consistent with the observed profile from ACS MIR. Model profiles are averaged over the 5° LS interval containing the ACS observation. The standard deviation represents the variability of the computed profiles within this interval. The plots correspond to the ACS MIR occultation 003308_N2_E_P1_11_F, located at latitude 57.14°N, longitude 149.68°E, 234.30° LS, LT = 8.33 h in MY 34.
Current usage metrics show cumulative count of Article Views (full-text article views including HTML views, PDF and ePub downloads, according to the available data) and Abstracts Views on Vision4Press platform.
Data correspond to usage on the plateform after 2015. The current usage metrics is available 48-96 hours after online publication and is updated daily on week days.
Initial download of the metrics may take a while.