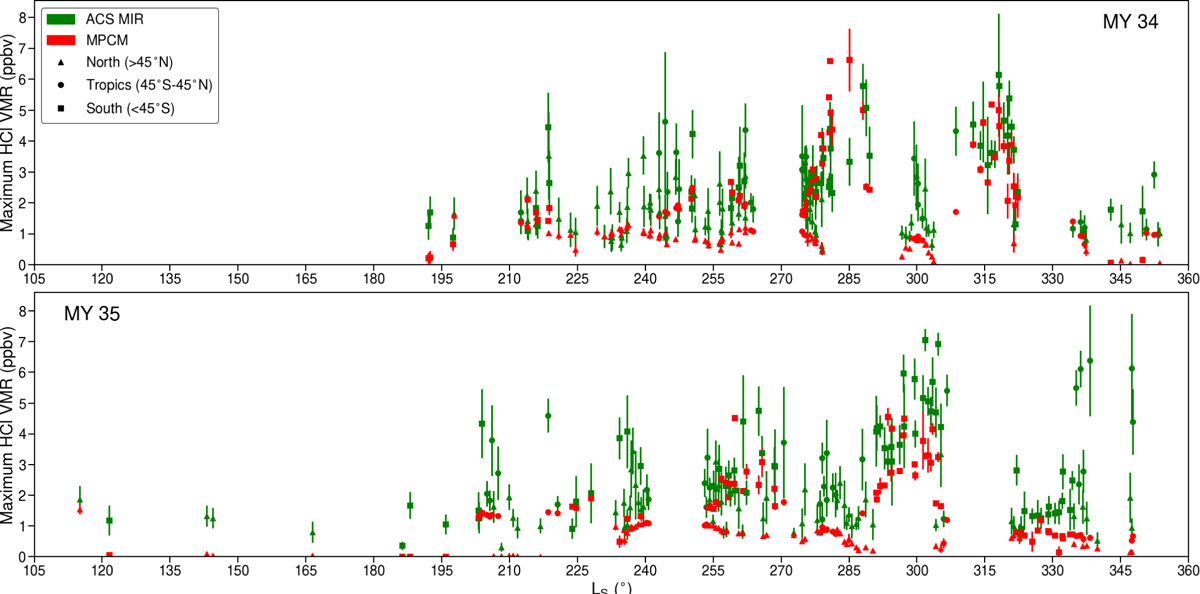
Fig. 2
Download original image
Maximum HCl VMR from our model (red) and ACS MIR (green) at every location where HCl was retrieved by the instrument during MY 34 (top) and MY 35 (bottom). Model maxima are extracted from the altitude range over which HCl is observed by ACS MIR. Triangles correspond to observations made at northern latitudes (>45°N), circles at tropical latitudes (45°S-45°N), and squares to southern latitudes (<45°S). Error bars display the standard deviation of modelled HCl within the 5°LS interval containing the observation and the uncertainty on the ACS value.
Current usage metrics show cumulative count of Article Views (full-text article views including HTML views, PDF and ePub downloads, according to the available data) and Abstracts Views on Vision4Press platform.
Data correspond to usage on the plateform after 2015. The current usage metrics is available 48-96 hours after online publication and is updated daily on week days.
Initial download of the metrics may take a while.