Fig. C.1
Download original image
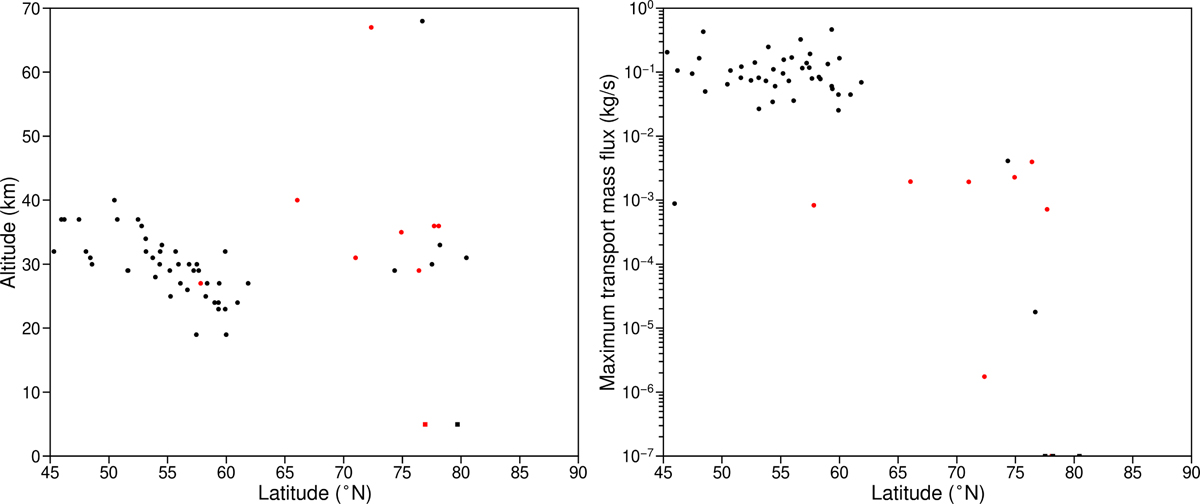
Horizontal transport modelled properties for northern latitudes (> 45°N) ACS MIR HCl detections of MY 35. Left: lowest altitude where the horizontal transport lifetime of HCl becomes lower than the photochemical lifetime (i.e. where horizontal transport can compete with chemistry) in the atmospheric column corresponding to the ACS MIR observation. Squares located at 5 km are used when the horizontal transport lifetime is larger than the photochemical lifetime in the entire column. Right: maximum net flux of HCl resulting from horizontal transport in the atmospheric column where the HCl observation is performed. Squares located at 10−7 kg/s are used when the maximum net mass flux in lower or equal to zero. In both panels, red dots indicate the observations where we find the largest negative biases between model results and ACS MIR observations in MY 35, corresponding to observations between LS=140-220°.
Current usage metrics show cumulative count of Article Views (full-text article views including HTML views, PDF and ePub downloads, according to the available data) and Abstracts Views on Vision4Press platform.
Data correspond to usage on the plateform after 2015. The current usage metrics is available 48-96 hours after online publication and is updated daily on week days.
Initial download of the metrics may take a while.