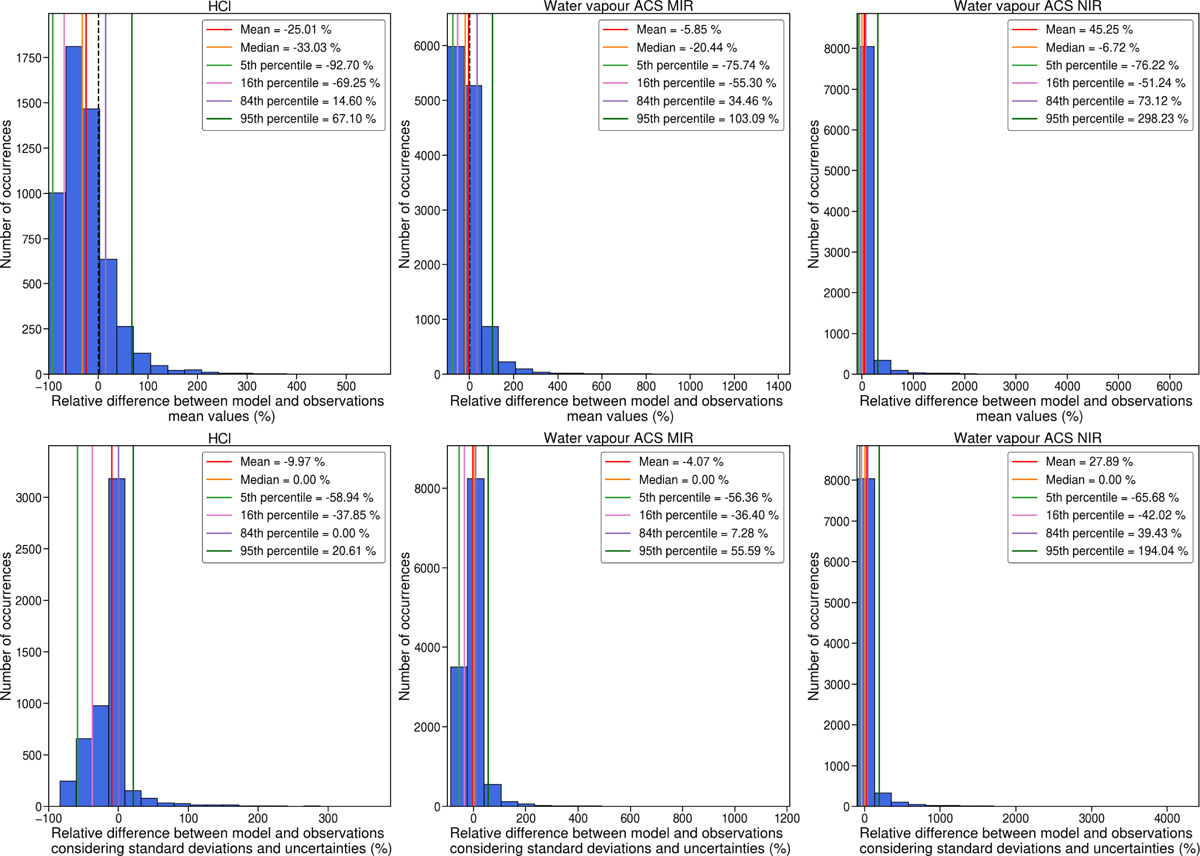
Fig. B.3
Download original image
Relative difference between modelled and observed HCl and water vapour VMRs. These are computed for each point of the retrieved profiles from ACS MIR/NIR observations where HCl was detected in MYs 34 and 35. Top panels present the relative difference between mean values, while bottom panels considers the standard deviations in model results and observations uncertainties in the computations.
Current usage metrics show cumulative count of Article Views (full-text article views including HTML views, PDF and ePub downloads, according to the available data) and Abstracts Views on Vision4Press platform.
Data correspond to usage on the plateform after 2015. The current usage metrics is available 48-96 hours after online publication and is updated daily on week days.
Initial download of the metrics may take a while.