Fig. 11
Download original image
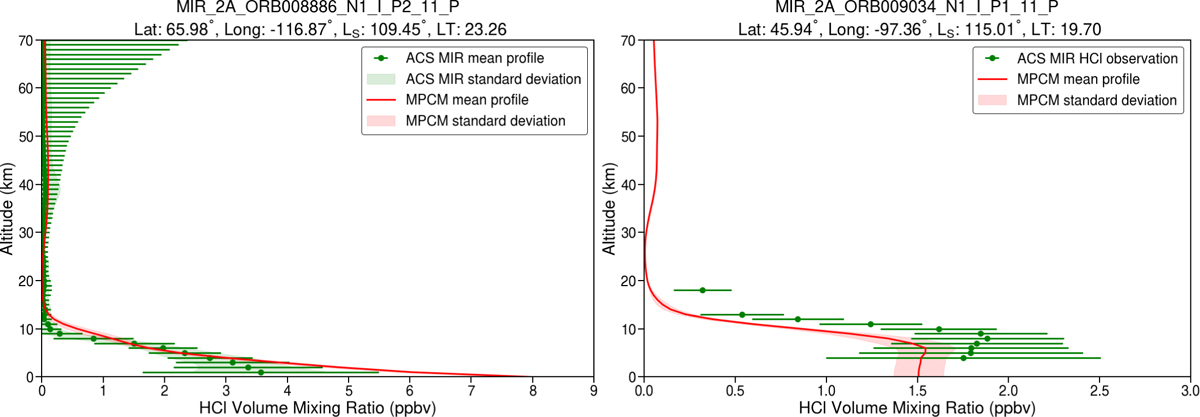
Mean vertical profiles of HCl for the two aphelion detections of MY 35. Error bars indicate the uncertainty of the ACS retrieved value, while the standard deviation reflects the variance among the retrieved profiles used to compute the mean. The model profile represents the mean HCl profile averaged over the 5° LS period containing the time of the ACS detection. The standard deviation indicates the 1-σ variation of this profile over this period.
Current usage metrics show cumulative count of Article Views (full-text article views including HTML views, PDF and ePub downloads, according to the available data) and Abstracts Views on Vision4Press platform.
Data correspond to usage on the plateform after 2015. The current usage metrics is available 48-96 hours after online publication and is updated daily on week days.
Initial download of the metrics may take a while.