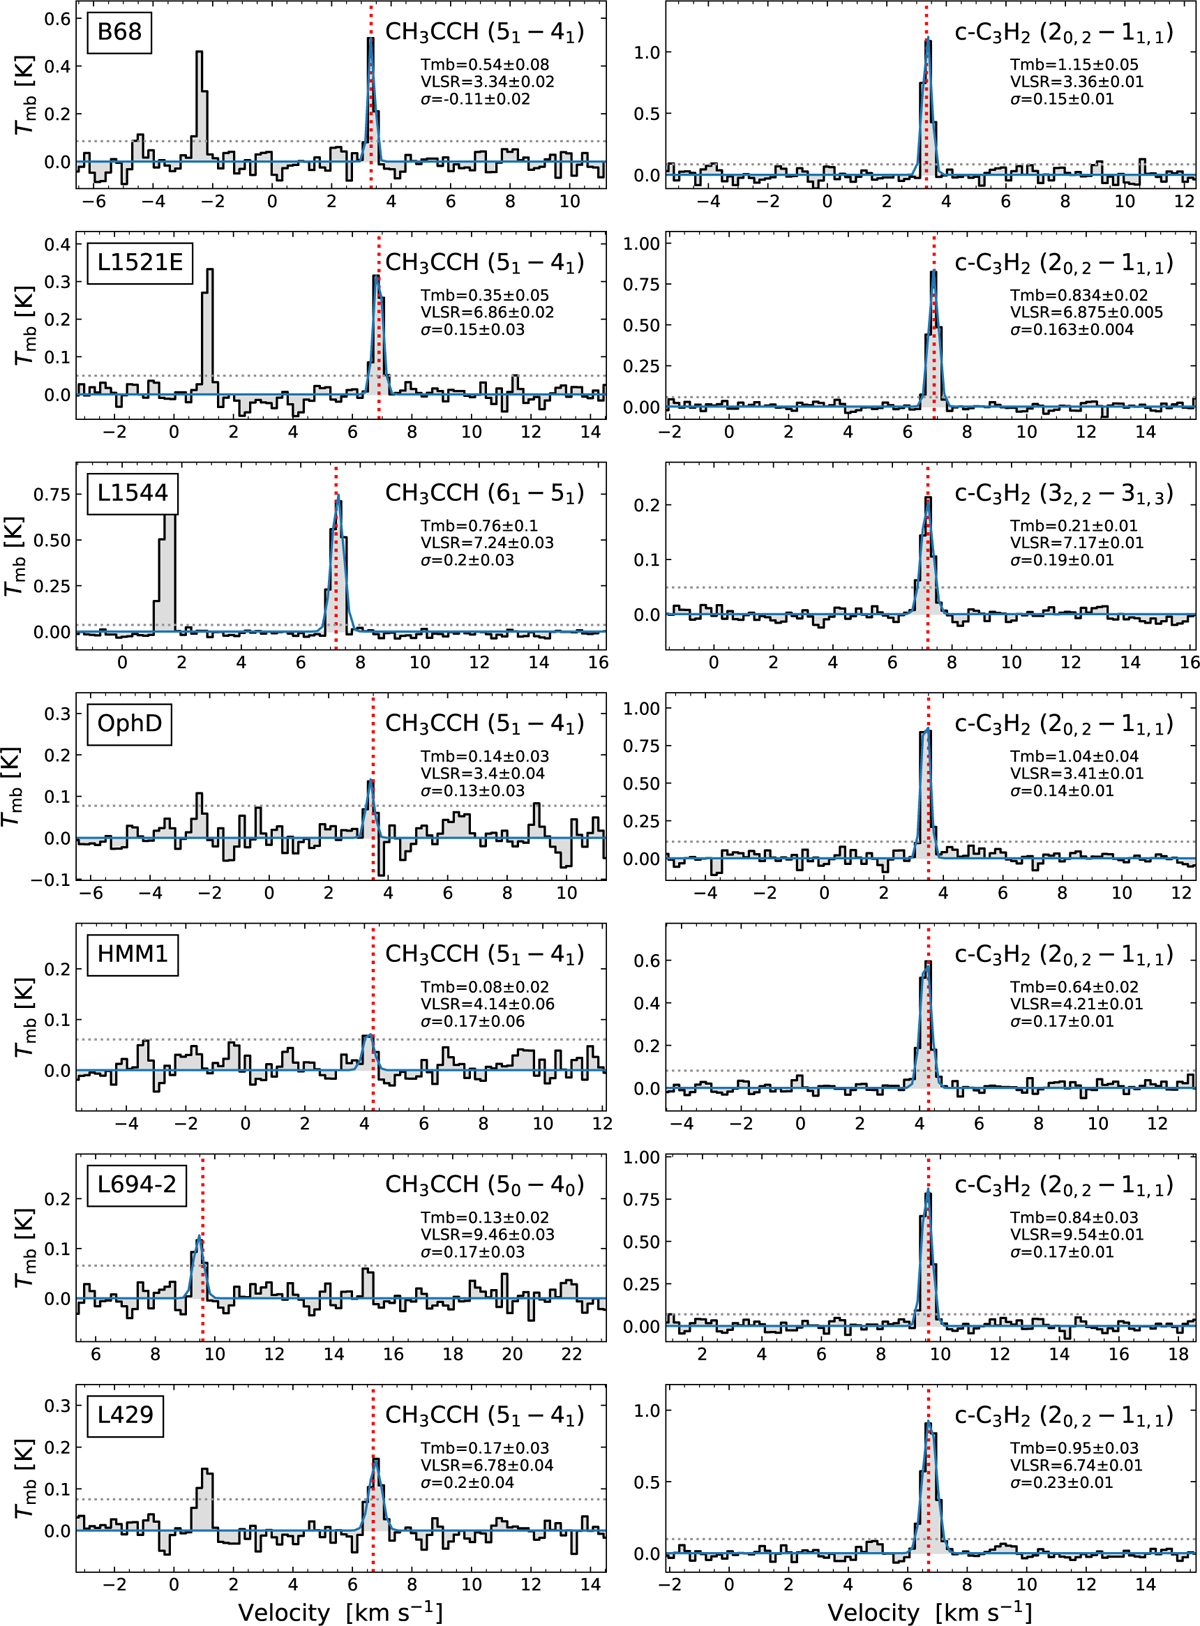
Fig. D.1
Download original image
Spectra of CH3CCH (left) and c-C3H2 (right) at the dust peak of each core (black) extracted within a circular aperture of radius 8" and the corresponding Gaussian fit (cyan). The 3σ level is indicated by the grey dotted line. The systemic velocity with respect to the line chosen for analysis is shown by the red dotted line. The Gaussian fit parameters are annotated for each line.
Current usage metrics show cumulative count of Article Views (full-text article views including HTML views, PDF and ePub downloads, according to the available data) and Abstracts Views on Vision4Press platform.
Data correspond to usage on the plateform after 2015. The current usage metrics is available 48-96 hours after online publication and is updated daily on week days.
Initial download of the metrics may take a while.