Open Access
Fig. 3
Download original image
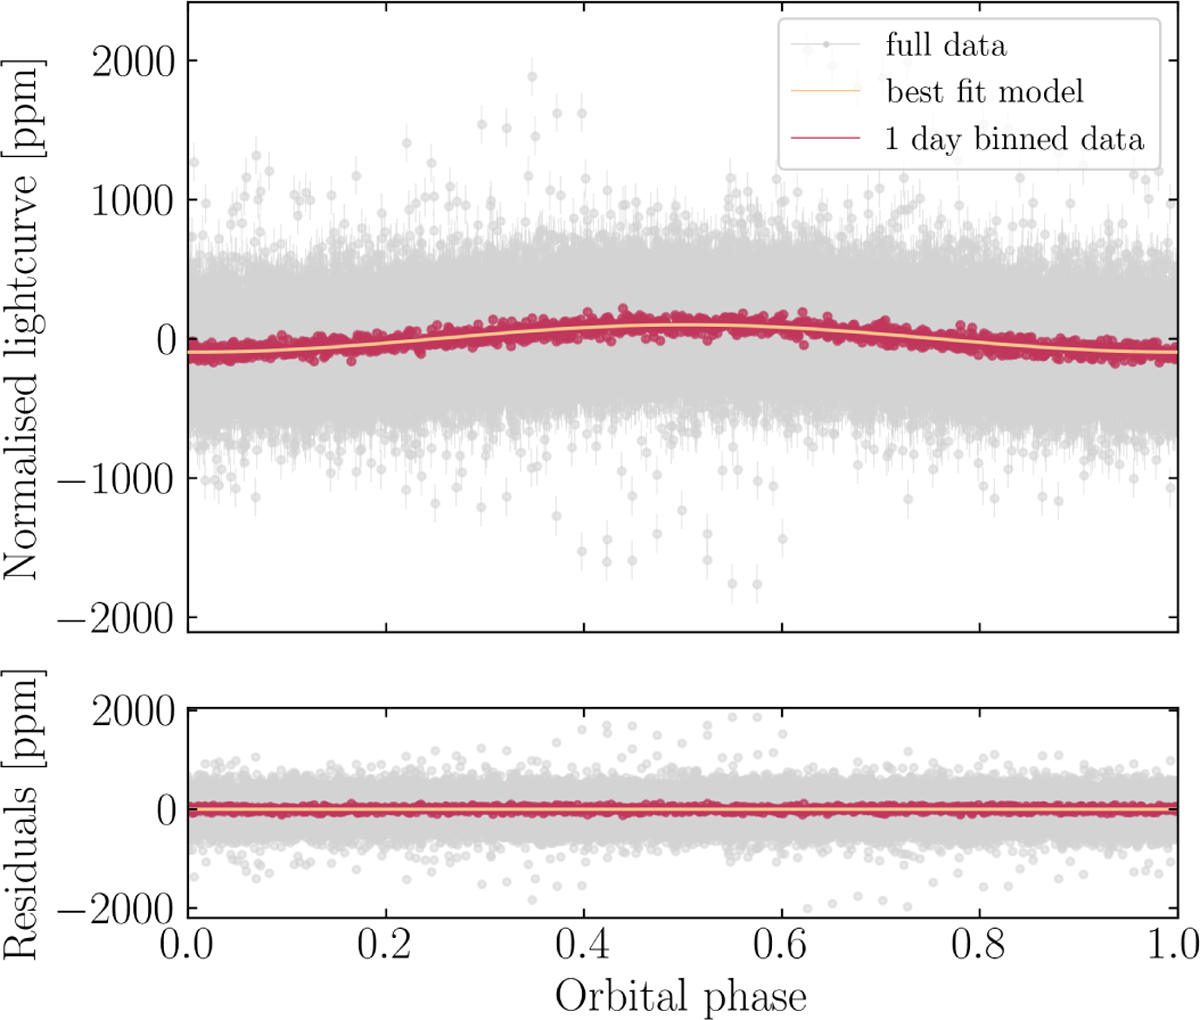
Phase-folded light curve of KIC 4930913, together with the best-fit model in orange. The red points correspond to data binned in 1-day intervals. The residuals show the difference between the model and the data points and are free of large systematic trends.
Current usage metrics show cumulative count of Article Views (full-text article views including HTML views, PDF and ePub downloads, according to the available data) and Abstracts Views on Vision4Press platform.
Data correspond to usage on the plateform after 2015. The current usage metrics is available 48-96 hours after online publication and is updated daily on week days.
Initial download of the metrics may take a while.