Fig. 2
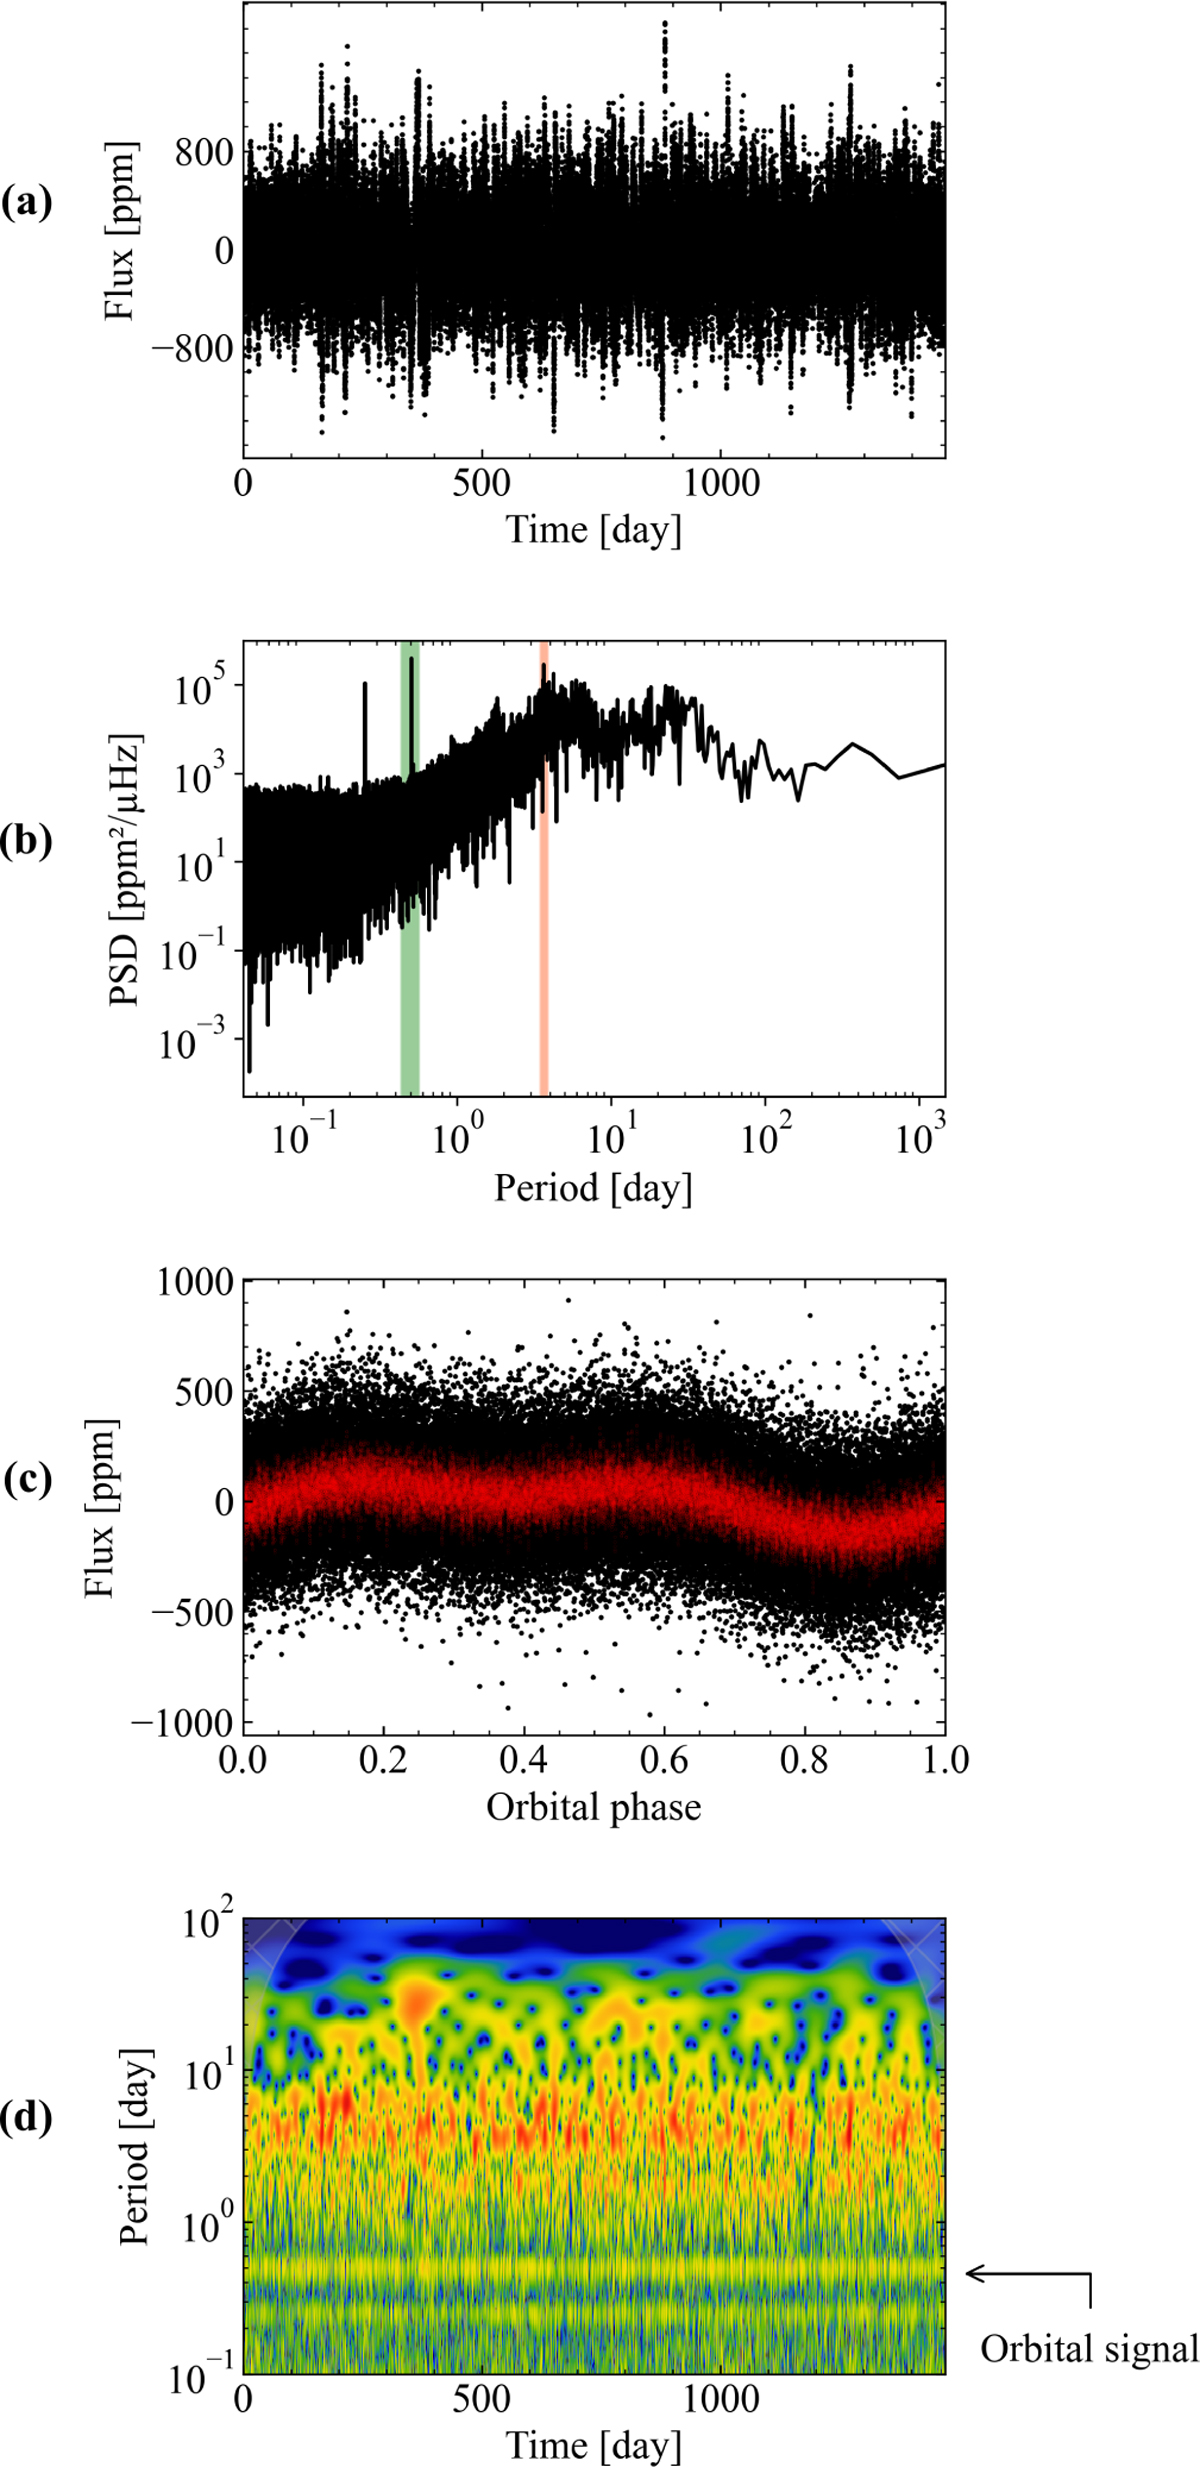
Download original image
Flux analysis of KIC 5697777. (a) Light curve calibrated according to the KEPSEISMIC method and filtered at 20 days. (b) Power spectral density of the light curve. The rotation period of the star is taken from Santos et al. (2021) and is located within the orange area. The green area shows the high-amplitude signal peak at around 0.5 days. The second high-amplitude signal peak located at around 0.25 days is the second harmonic of the orbital signal. (c) Phase-folding of the light curve with an additional filter to remove the stellar rotational contribution. The red curve is a smoothing of the black curve, obtained with a triangular filter. (d) Wavelet power spectrum of the light curve. A high-amplitude periodicity is highlighted by orange and red, whereas yellow and blue denote a low-power amplitude. The yellow bands with a constant period throughout time correspond to the high-amplitude peak and its second harmonic, identified in panel b. The reddish band corresponds to the rotation period and its harmonics, highlighted in orange in panel b. The shaded area represents the cone of influence of the reliable periodicities.
Current usage metrics show cumulative count of Article Views (full-text article views including HTML views, PDF and ePub downloads, according to the available data) and Abstracts Views on Vision4Press platform.
Data correspond to usage on the plateform after 2015. The current usage metrics is available 48-96 hours after online publication and is updated daily on week days.
Initial download of the metrics may take a while.