Fig. 4.
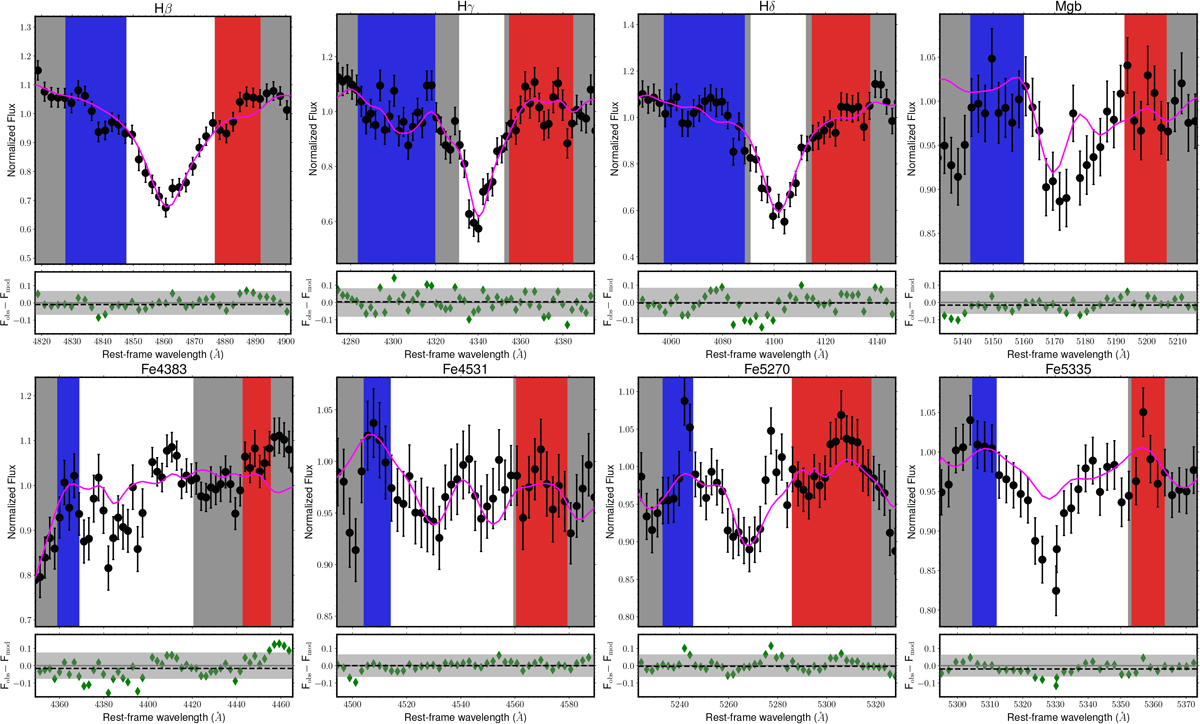
Download original image
Comparison of the observed indices (black dots show the spectral pixels) with the predictions of the FIF best-fit models (magenta line), with an age of 0.81 Gyr and a metallicity of −0.19 dex. The blue and red regions correspond to the wavelengths where the pseudo-continua are measured and the white regions are the wavelengths where the index is measured. In the bottom panels the residuals are plotted as green diamonds. The gray lines and shaded regions are the median of the residuals and the average observed errors on the indices, respectively, while the black dashed line marks the 0.
Current usage metrics show cumulative count of Article Views (full-text article views including HTML views, PDF and ePub downloads, according to the available data) and Abstracts Views on Vision4Press platform.
Data correspond to usage on the plateform after 2015. The current usage metrics is available 48-96 hours after online publication and is updated daily on week days.
Initial download of the metrics may take a while.