Fig. A.2.
Download original image
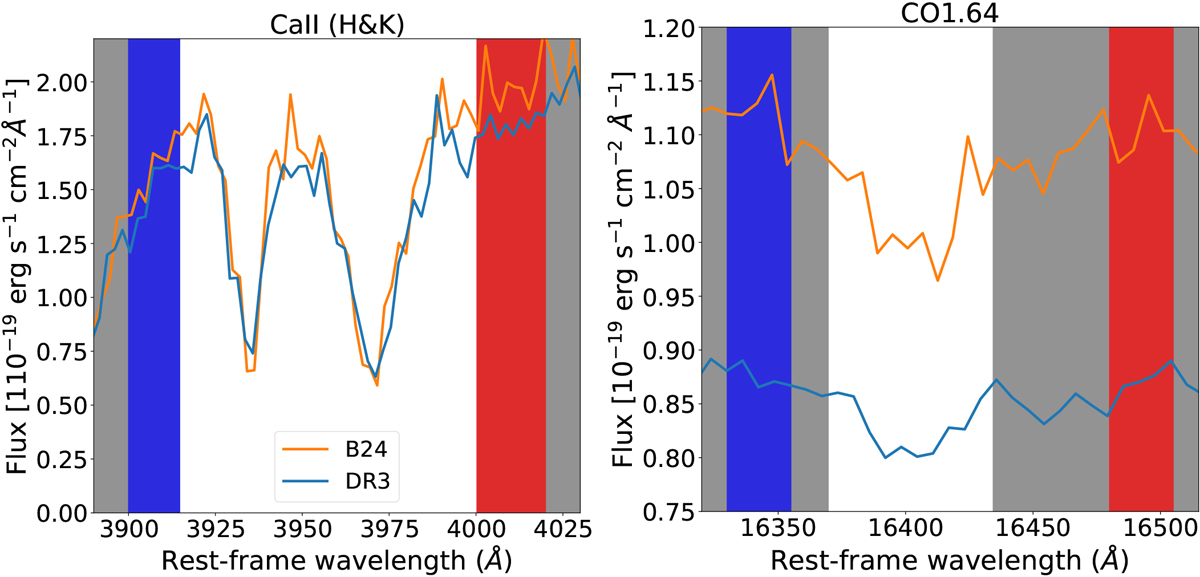
CaII (H&K) index (left panel) and CO1.64 index (right panel) for the two data reductions, DR3 (blue) and B24 (orange). The measurements of the former (latter) index are consistent (inconsistent) when measured from the two data reductions. In both panels, the white central region is the wavelength region where the feature is measured, while blue and red regions are the blue and red continuum bandpasses, respectively.
Current usage metrics show cumulative count of Article Views (full-text article views including HTML views, PDF and ePub downloads, according to the available data) and Abstracts Views on Vision4Press platform.
Data correspond to usage on the plateform after 2015. The current usage metrics is available 48-96 hours after online publication and is updated daily on week days.
Initial download of the metrics may take a while.