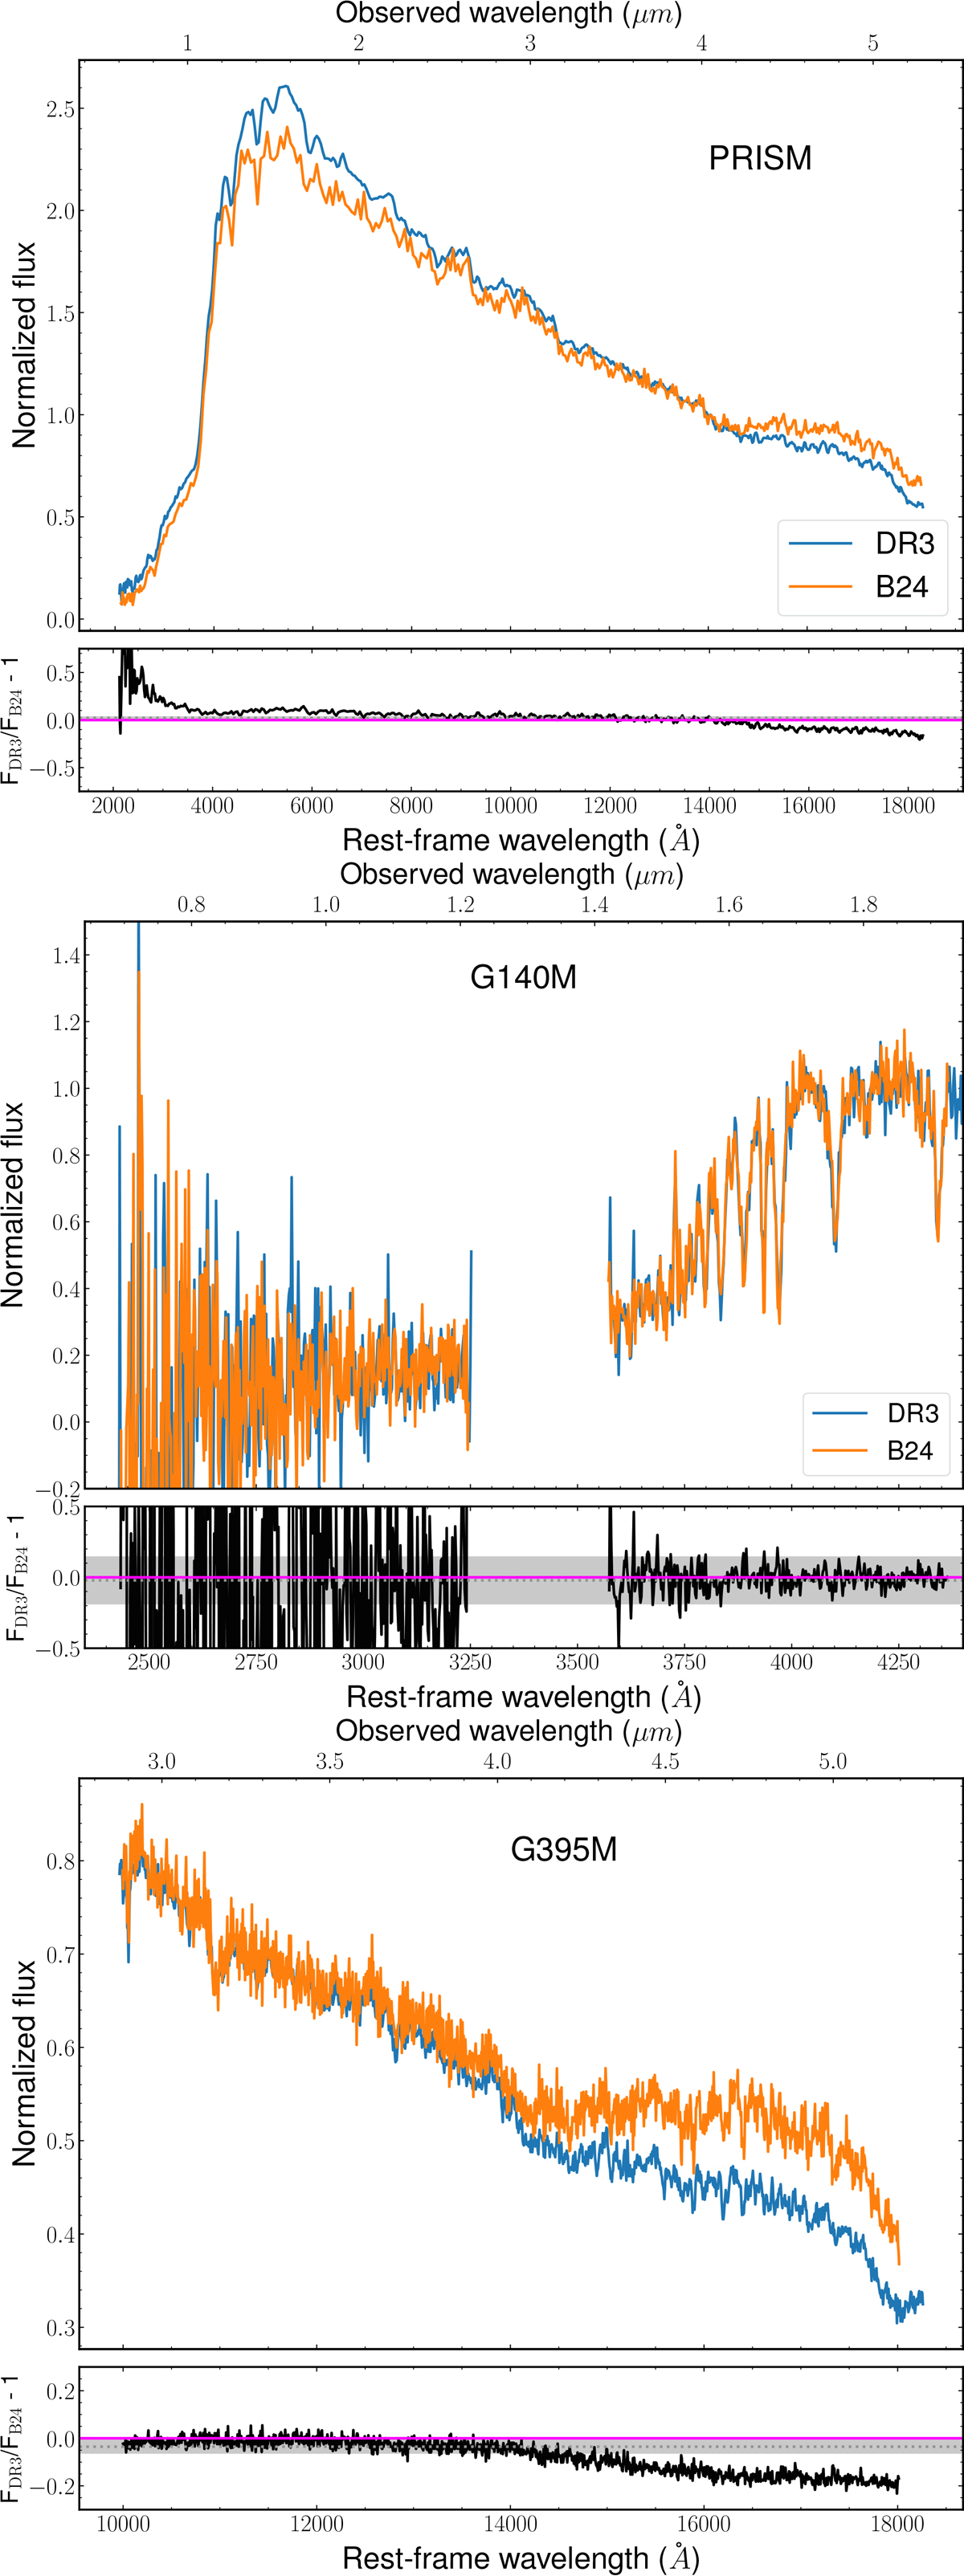
Fig. A.1.
Download original image
Comparison of the G140M (upper panel), G395M (middle panel), and prism (lower panel) spectra for the data reduction of the JADES DR3 (orange) and B24 (blue). The black lines are the flux ratios FDR3/FB24−1, the gray dotted lines and shaded regions are the median values and the quadratic errors on the flux, respectively, while the magenta line marks the zero.
Current usage metrics show cumulative count of Article Views (full-text article views including HTML views, PDF and ePub downloads, according to the available data) and Abstracts Views on Vision4Press platform.
Data correspond to usage on the plateform after 2015. The current usage metrics is available 48-96 hours after online publication and is updated daily on week days.
Initial download of the metrics may take a while.