Fig. 1.
Download original image
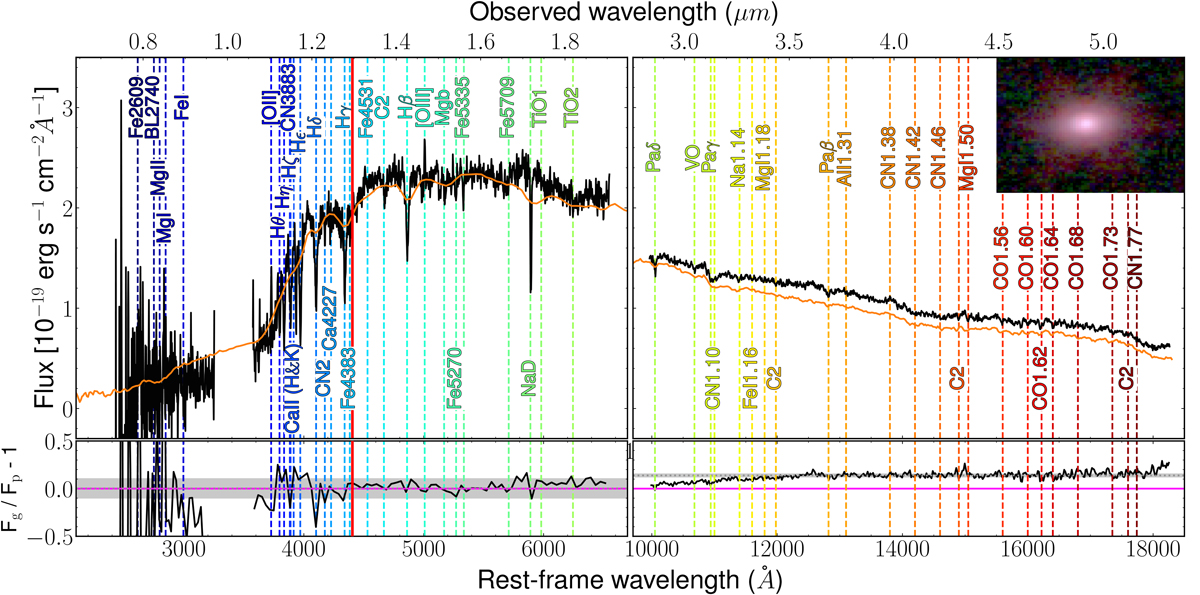
Spectrum of the JWST of J-138717. The rest-frame wavelengths are calculated with respect to the spectroscopic redshift, z = 1.8845 (see sect. 3.1). The combined RGB imaging of the galaxy is shown in the upper right corner. The observed spectra are shown in the upper panels. The black lines show the medium-resolution G140M/F070LP and G395M/F290LP spectra, while the overplotted orange line shows the prism spectrum (we note that the prism spectrum also covers the rest-frame interval ∼6500−10 000 Å; see, e.g., Fig. A.1). The two lower panels show the comparison of the flux of the prism and grating spectra (black line). In both panels, the magenta line marks a difference of zero, and the gray lines and shadow regions indicate the median and the average errors, respectively. The vertical red line in the left panels marks λ = 1.27 μm, above which the spectrum is potentially affected by second-order contamination. In all panels, the vertical dashed lines correspond to different absorption and emission lines.
Current usage metrics show cumulative count of Article Views (full-text article views including HTML views, PDF and ePub downloads, according to the available data) and Abstracts Views on Vision4Press platform.
Data correspond to usage on the plateform after 2015. The current usage metrics is available 48-96 hours after online publication and is updated daily on week days.
Initial download of the metrics may take a while.