Open Access
Fig. 6
Download original image
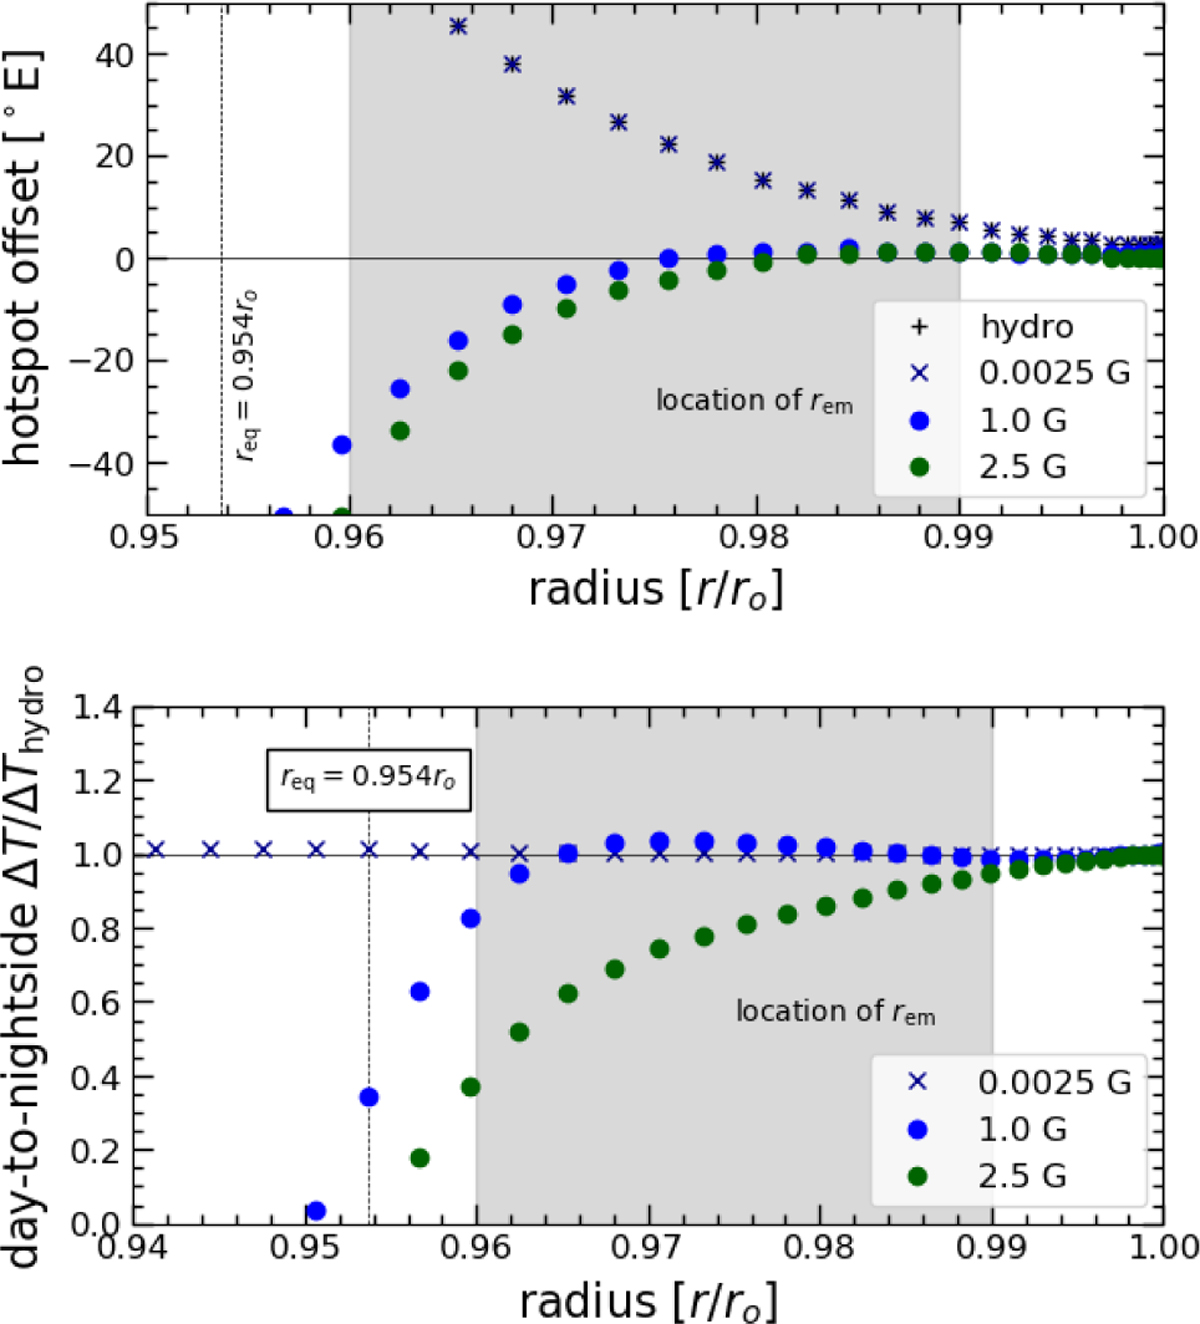
Hotspot offset as a function of depth for the different runs (top) and dayside-to-nightside temperature difference for the magnetic cases normalized with the difference in the hydrodynamic case (bottom). The possible range of emission layers contributing to the observation is indicated in gray.
Current usage metrics show cumulative count of Article Views (full-text article views including HTML views, PDF and ePub downloads, according to the available data) and Abstracts Views on Vision4Press platform.
Data correspond to usage on the plateform after 2015. The current usage metrics is available 48-96 hours after online publication and is updated daily on week days.
Initial download of the metrics may take a while.