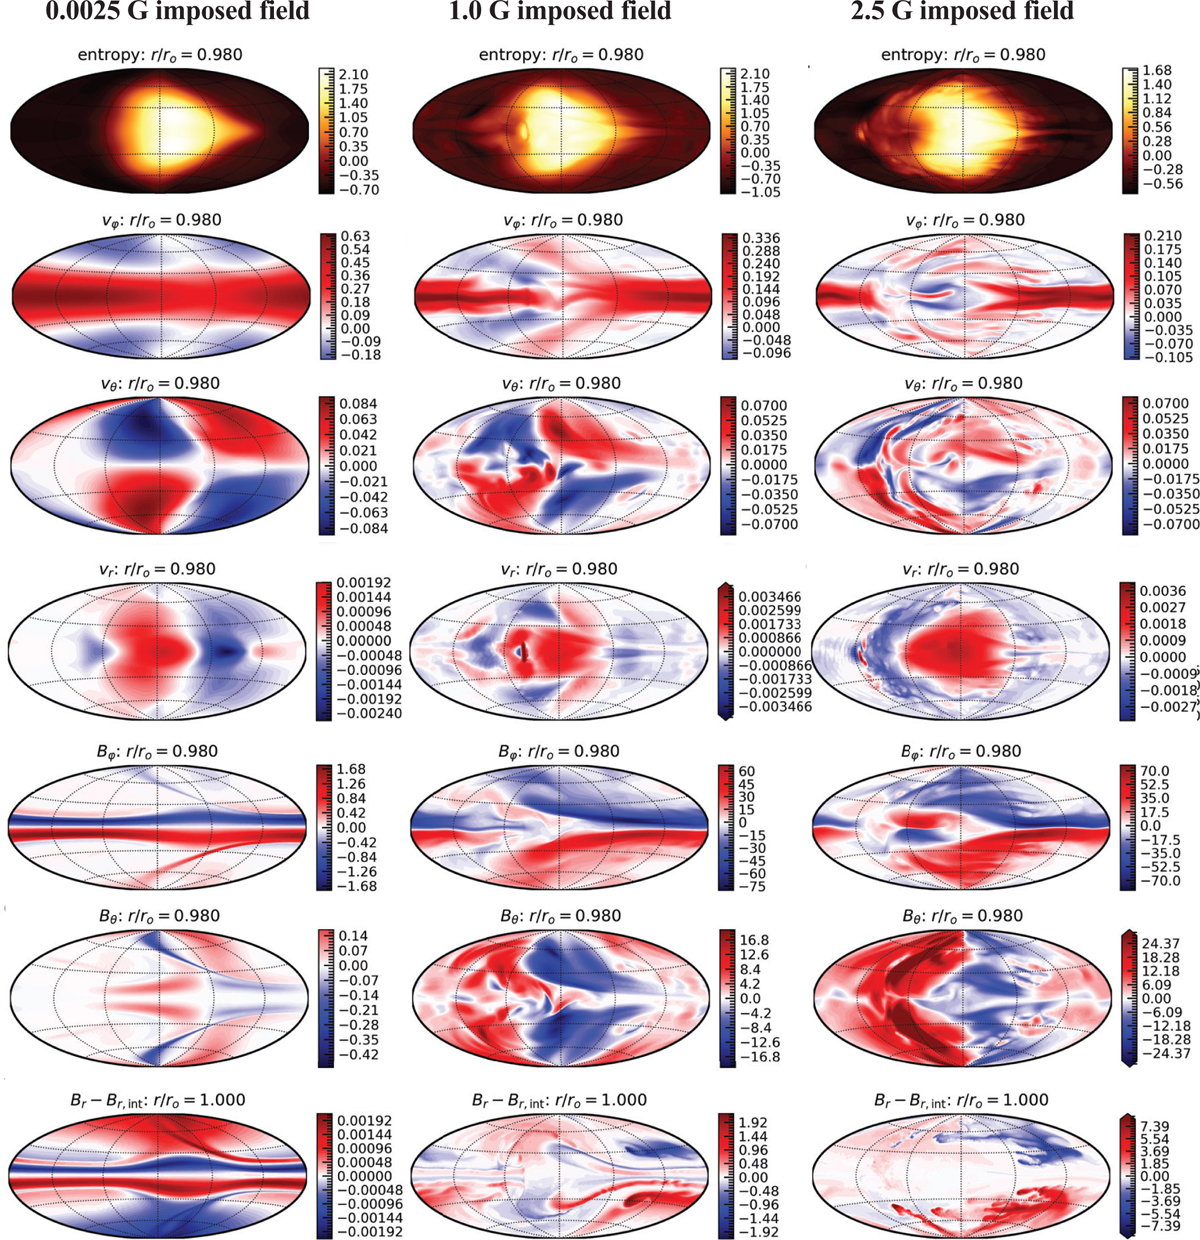
Fig. 2
Download original image
Snapshots of three simulations for a very weak (left), a strong (middle), and a very strong (right) imposed axial dipole field. The top row shows the entropy map close to the outer boundary. The following three rows show azimuthal, latitudinal, and radial flows given in fractions of the rotation speed. The azimuthal and latitudinal magnetic fields close to the outer boundary are shown in rows 6 and 7. The last row shows the radial magnetic field at the outer boundary with the imposed dipole being subtracted. Magnetic fields are given in Gauss. Red (blue) indicates eastward, outward, or southward (westward, inward, or northward) directions.
Current usage metrics show cumulative count of Article Views (full-text article views including HTML views, PDF and ePub downloads, according to the available data) and Abstracts Views on Vision4Press platform.
Data correspond to usage on the plateform after 2015. The current usage metrics is available 48-96 hours after online publication and is updated daily on week days.
Initial download of the metrics may take a while.