Fig. 15.
Download original image
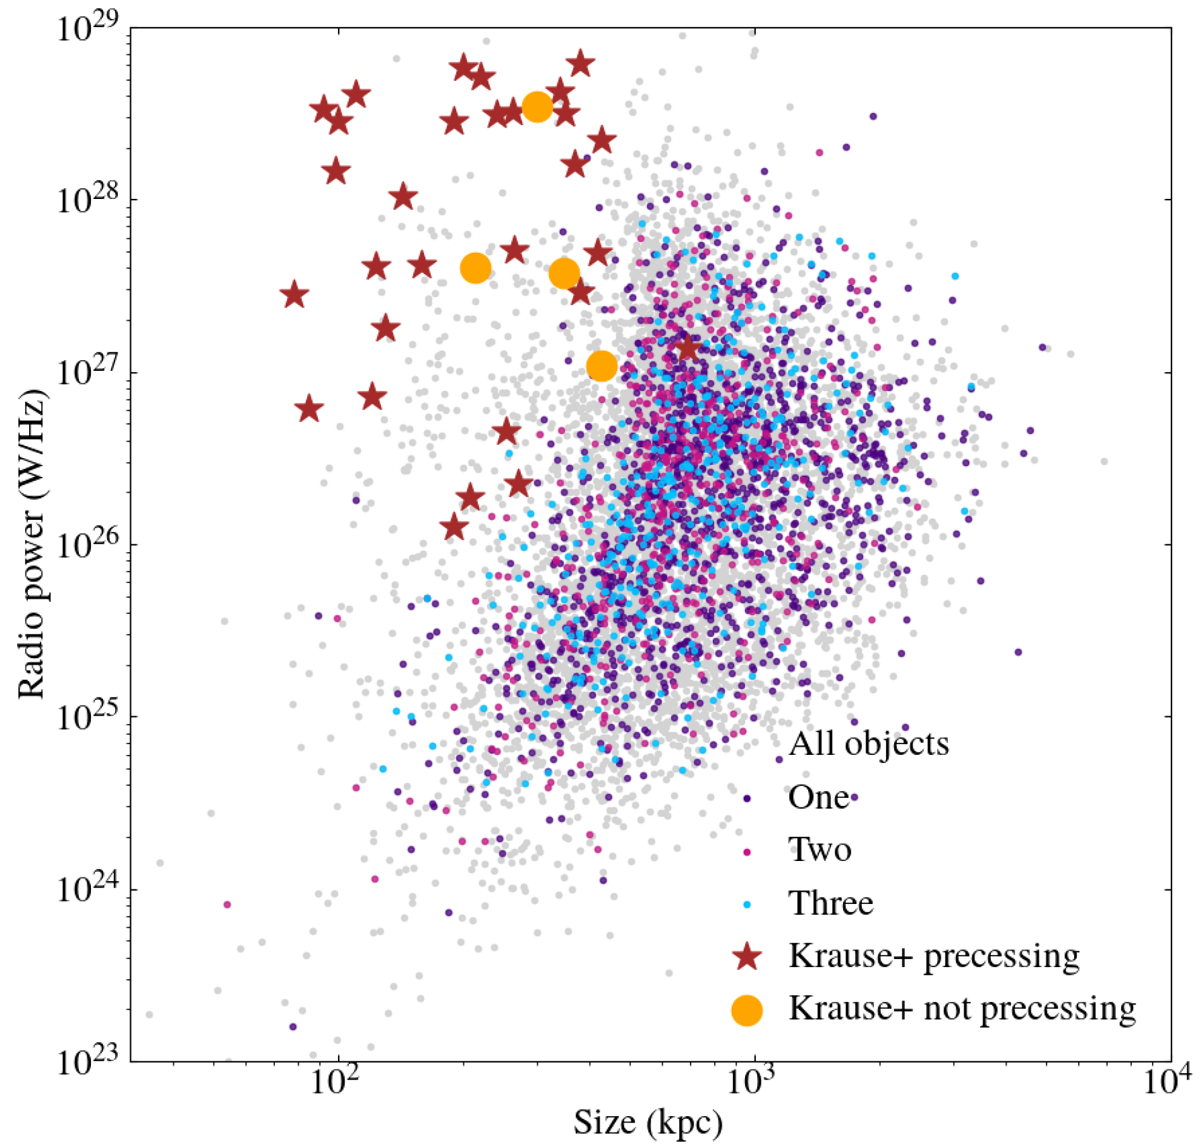
Power-linear size diagram showing the distribution of sources with one (purple), two (magenta), and all three (pale blue), precession indicators. Overplotted are the positions of 3CRR sources examined by Krause et al. (2019), where the red stars represent sources with potential precession indicators and the orange circles are those without.
Current usage metrics show cumulative count of Article Views (full-text article views including HTML views, PDF and ePub downloads, according to the available data) and Abstracts Views on Vision4Press platform.
Data correspond to usage on the plateform after 2015. The current usage metrics is available 48-96 hours after online publication and is updated daily on week days.
Initial download of the metrics may take a while.