Open Access
Fig. 13.
Download original image
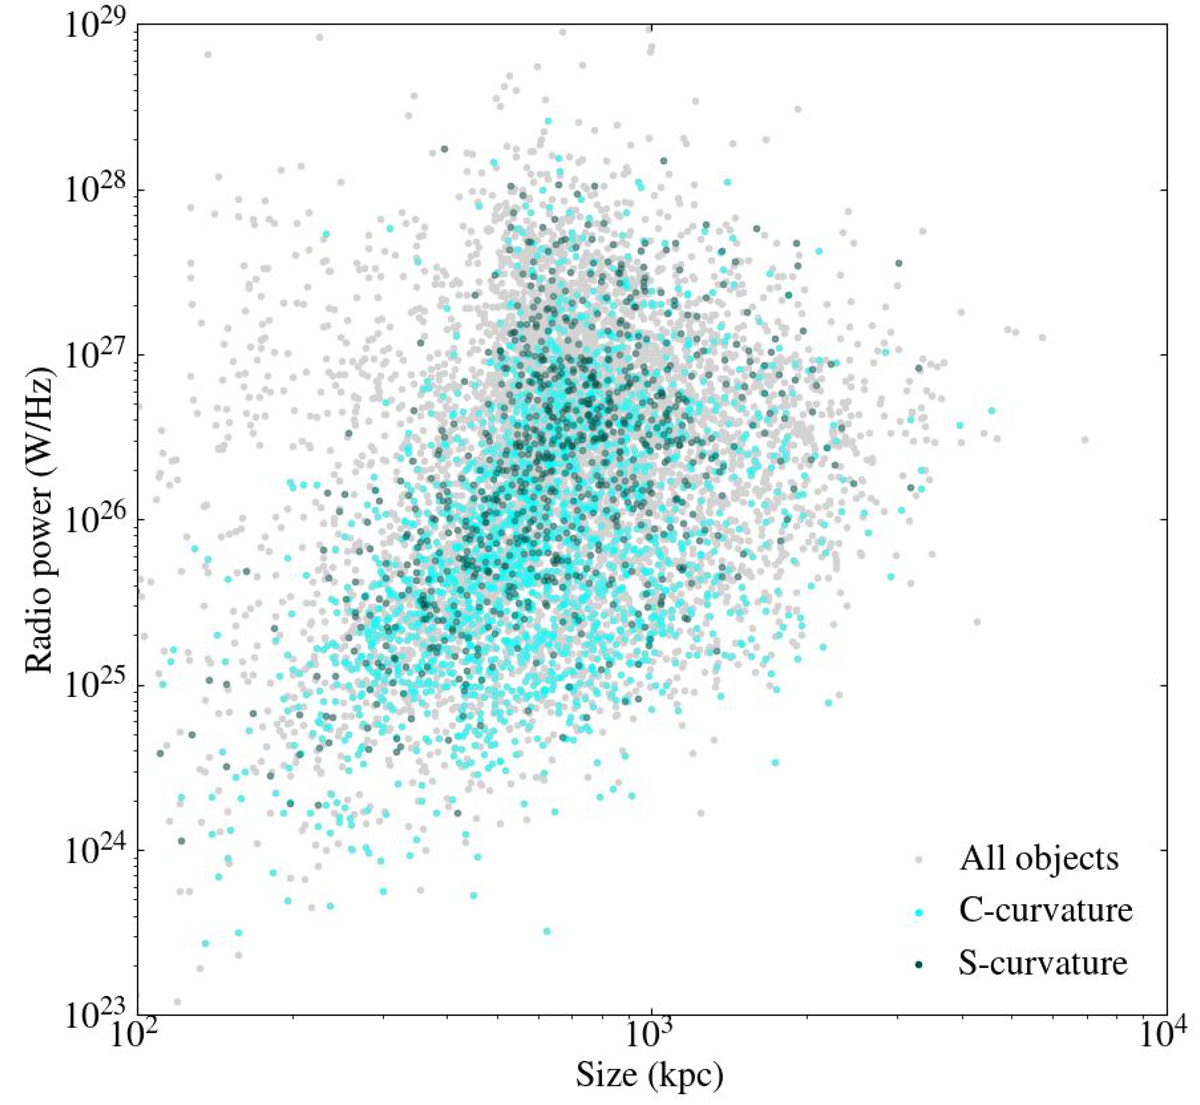
Power linear-size diagram showing the population of sources with S- and C-shaped curvature. Grey sources represent the full population while sources with C-curvature are presented in light cyan while S-curvature sources are shown in dark teal.
Current usage metrics show cumulative count of Article Views (full-text article views including HTML views, PDF and ePub downloads, according to the available data) and Abstracts Views on Vision4Press platform.
Data correspond to usage on the plateform after 2015. The current usage metrics is available 48-96 hours after online publication and is updated daily on week days.
Initial download of the metrics may take a while.