Open Access
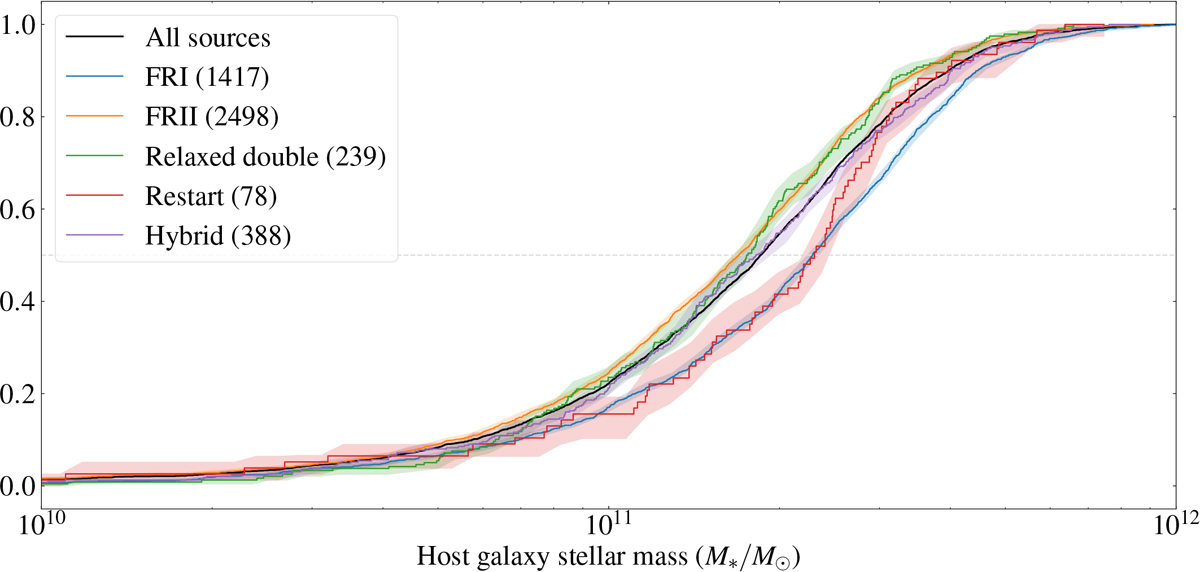
Fig. 11.
Download original image
Cumulative distribution of mass as a function of morphological indicator. The solid line shows the mass distribution for all sources in the sample and the coloured lines indicate morphological subsamples. The shaded areas show 1σ confidence intervals from bootstrap and the faint dashed line shows the location of the median.
Current usage metrics show cumulative count of Article Views (full-text article views including HTML views, PDF and ePub downloads, according to the available data) and Abstracts Views on Vision4Press platform.
Data correspond to usage on the plateform after 2015. The current usage metrics is available 48-96 hours after online publication and is updated daily on week days.
Initial download of the metrics may take a while.