Fig. 9
Download original image
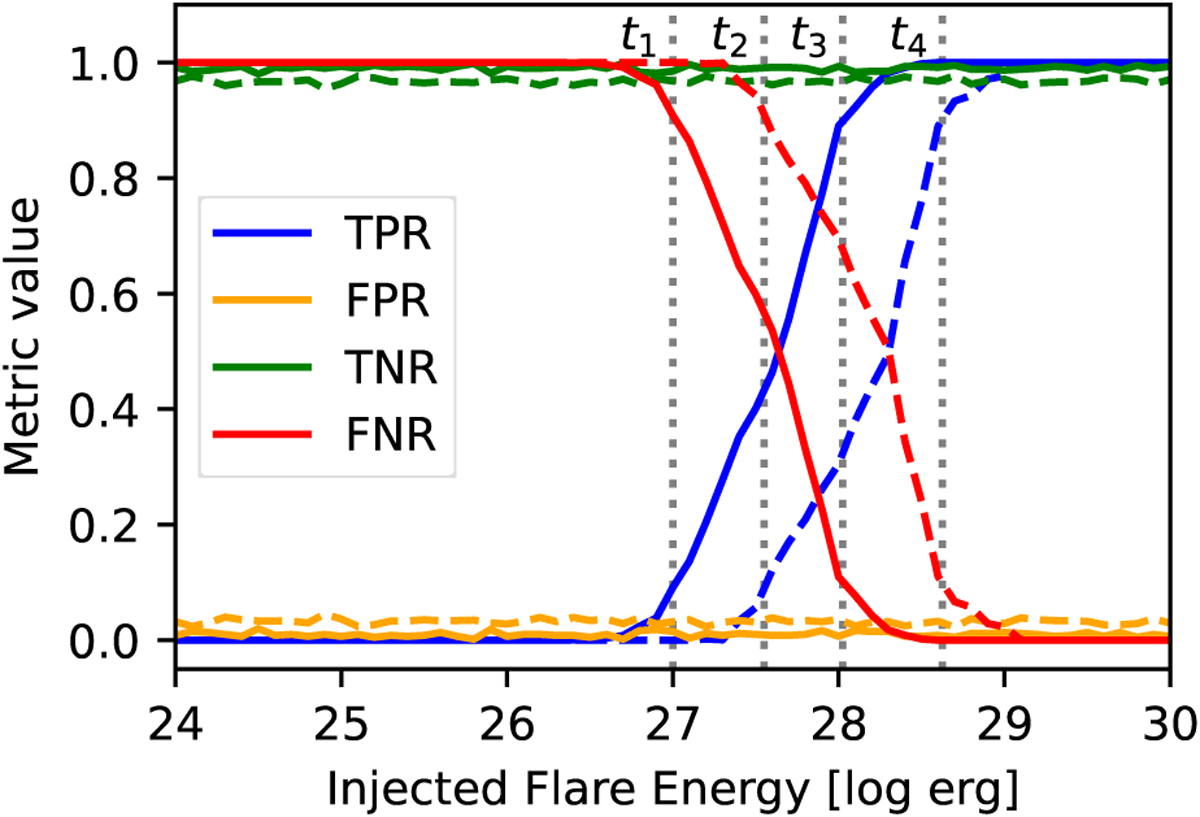
Evolution of confusion matrix metrics as a function of the injected flare energy. The TPR is shown in blue, the FPR in orange, the TNR in green, and the FNR in red. Metrics for the original light curves are represented by dashed lines, while those for the denoised light curves are shown as solid lines. The vertical black dotted lines indicate the four detection thresholds.
Current usage metrics show cumulative count of Article Views (full-text article views including HTML views, PDF and ePub downloads, according to the available data) and Abstracts Views on Vision4Press platform.
Data correspond to usage on the plateform after 2015. The current usage metrics is available 48-96 hours after online publication and is updated daily on week days.
Initial download of the metrics may take a while.