Fig. 6
Download original image
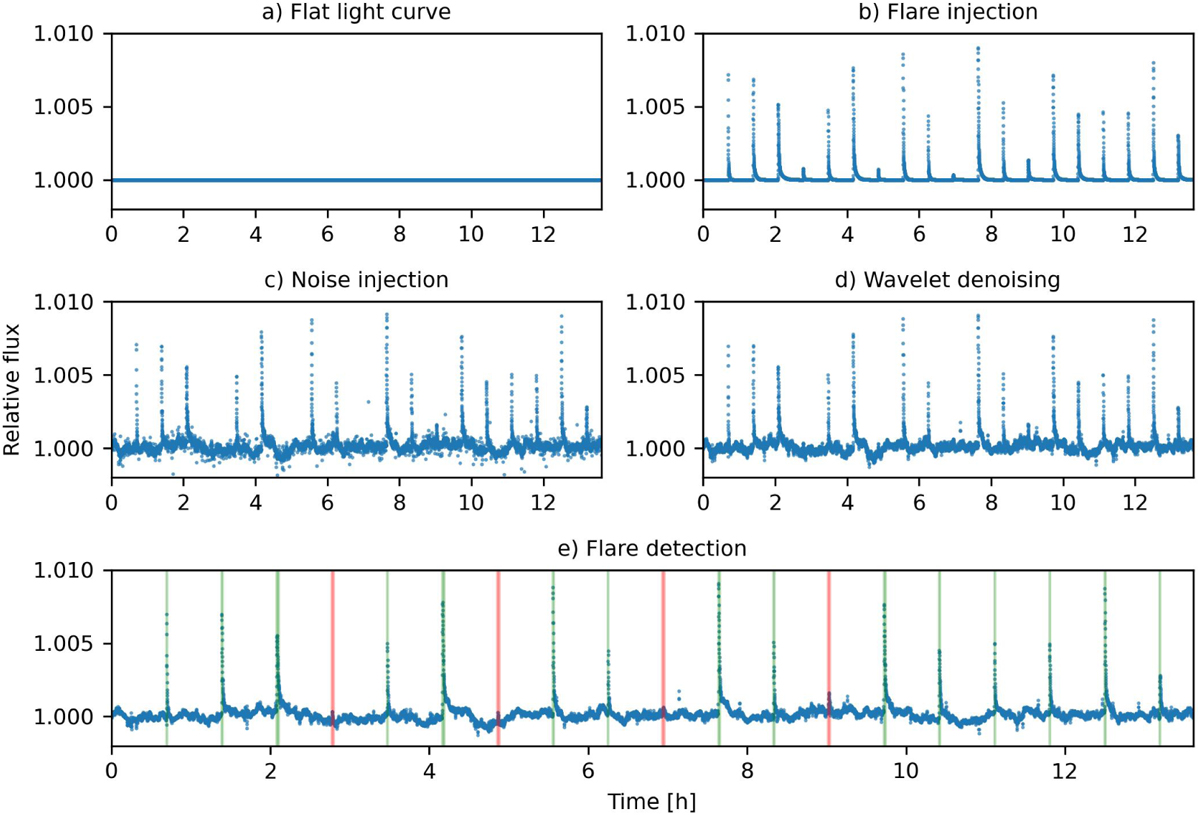
Step-by-step representation of the flare injection, noise injection, wavelet denoising, and flare recovery process. Only 20 flares are shown to better visualise the flux variations in the light curve. In this example, the wavelet-based denoising was conducted with the Haar wavelet and a decomposition level of 2. Only 16 out of 19 flares are recovered in this portion of the light curve. The recovered and lost flare candidates are highlighted with a green and red background, respectively.
Current usage metrics show cumulative count of Article Views (full-text article views including HTML views, PDF and ePub downloads, according to the available data) and Abstracts Views on Vision4Press platform.
Data correspond to usage on the plateform after 2015. The current usage metrics is available 48-96 hours after online publication and is updated daily on week days.
Initial download of the metrics may take a while.