Fig. 21
Download original image
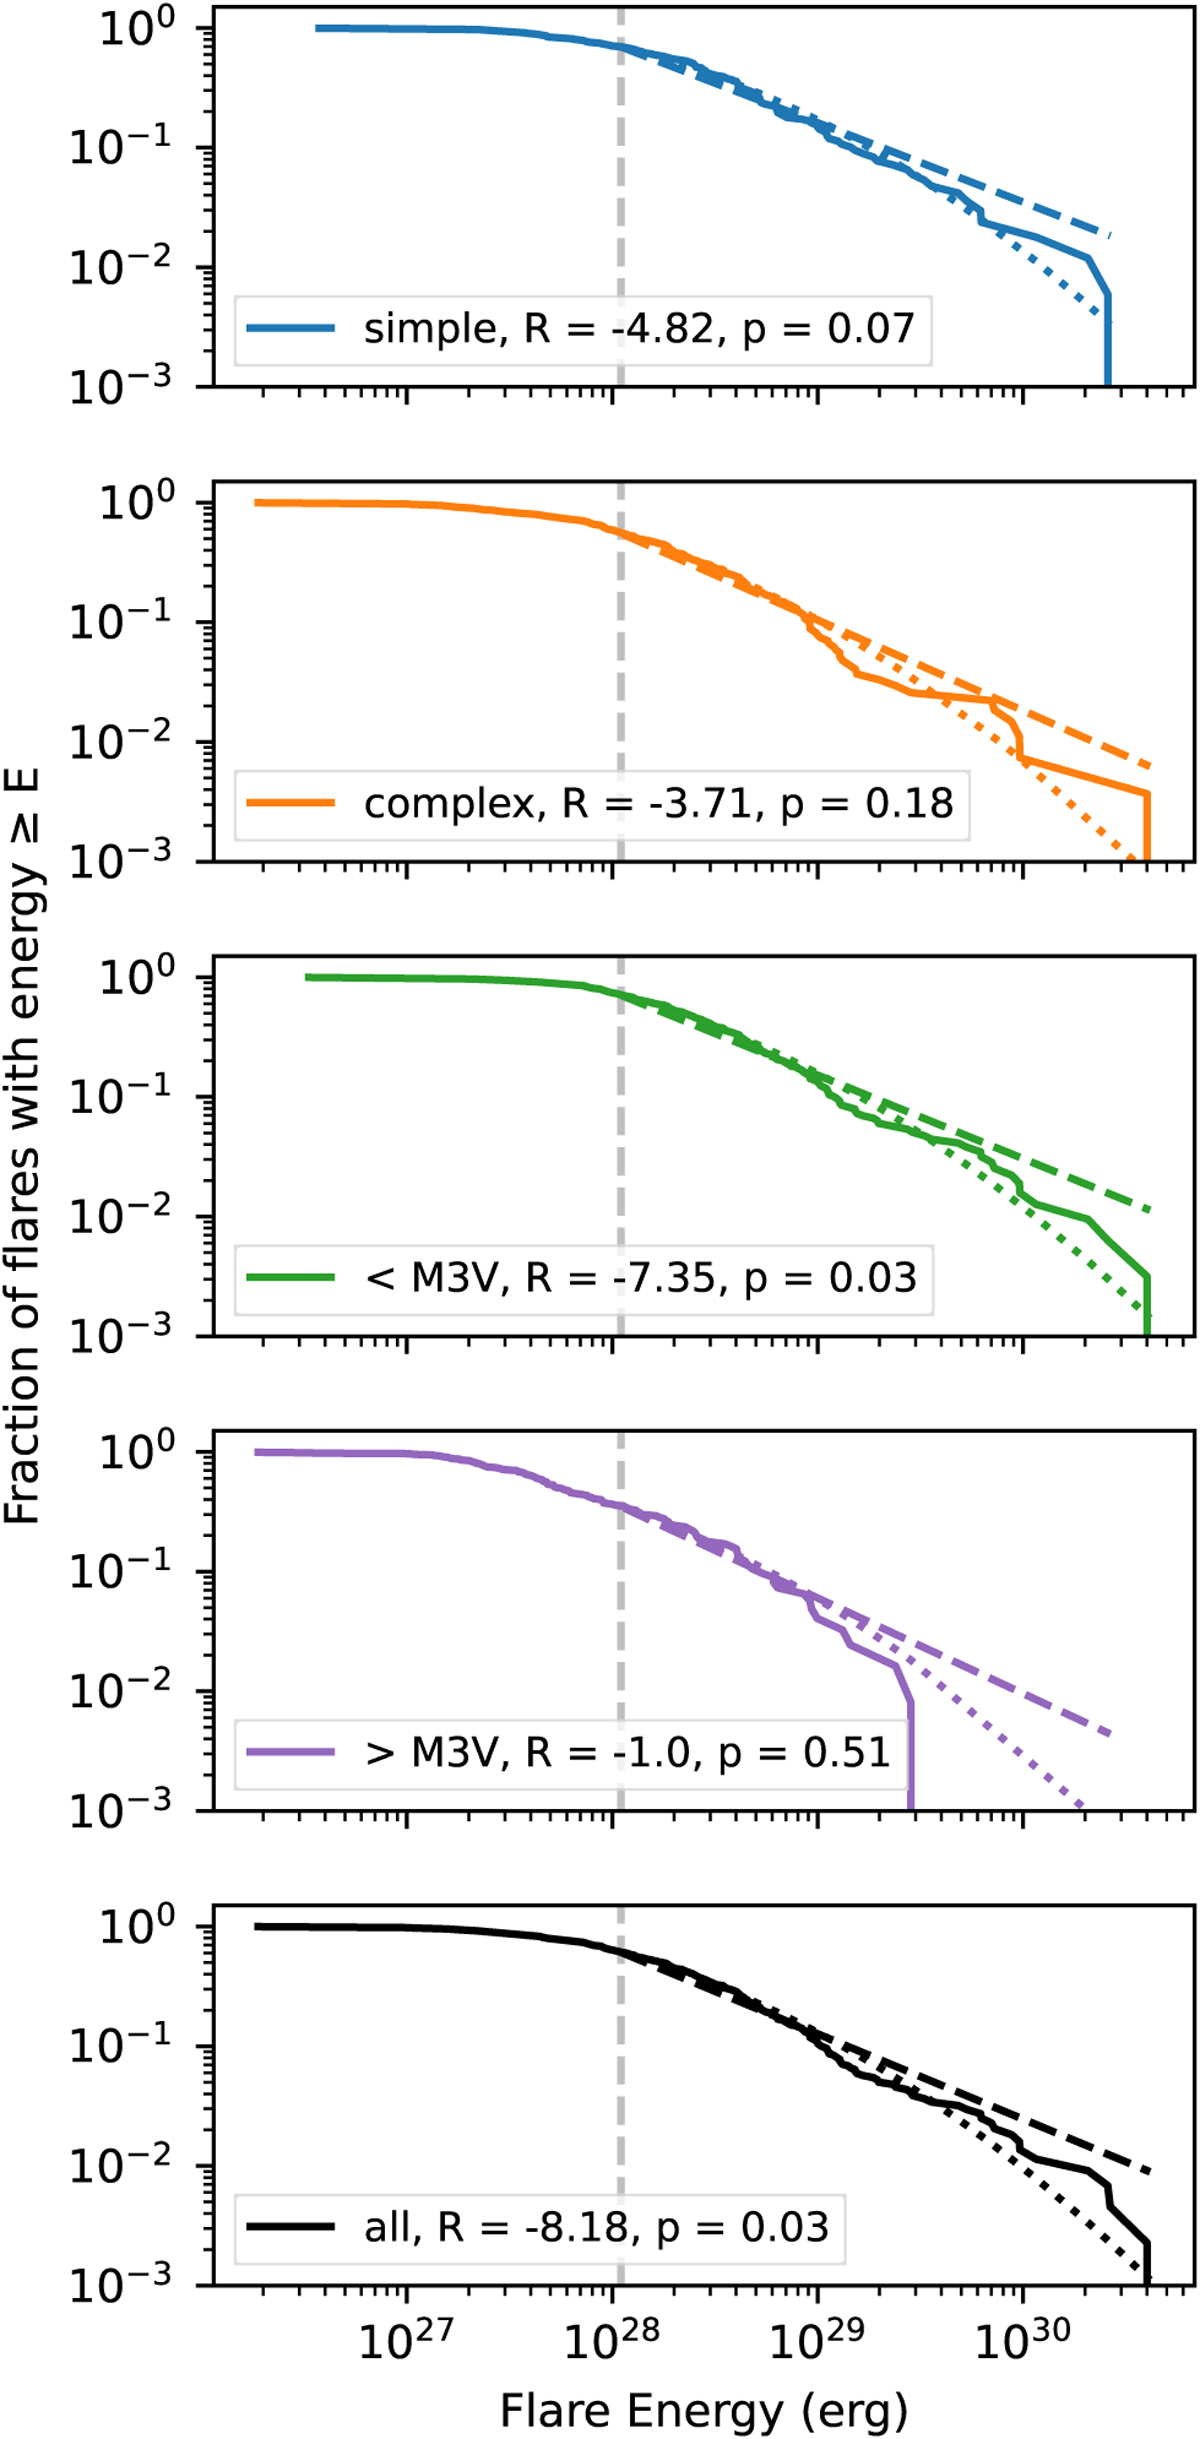
Complementary cumulative distribution functions for recovered flare energies in denoised light curves. We separate flares into simple events (blue) and individual components of complex flares (orange), as well as flares from partially (green) and fully convective stars (purple). The full flare sample is displayed in black. Observed distributions, power-law fits, and log-normal fits are displayed with solid lines, dashed lines, and dotted lines, respectively. The grey dashed vertical lines indicate the energy of 90% recovery (t3) and the beginning of the energy range used for fitting. In each panel, the legend indicates the log-likelihood ratio R between the power-law and log-normal fits and its associated p-value.
Current usage metrics show cumulative count of Article Views (full-text article views including HTML views, PDF and ePub downloads, according to the available data) and Abstracts Views on Vision4Press platform.
Data correspond to usage on the plateform after 2015. The current usage metrics is available 48-96 hours after online publication and is updated daily on week days.
Initial download of the metrics may take a while.