Fig. 17
Download original image
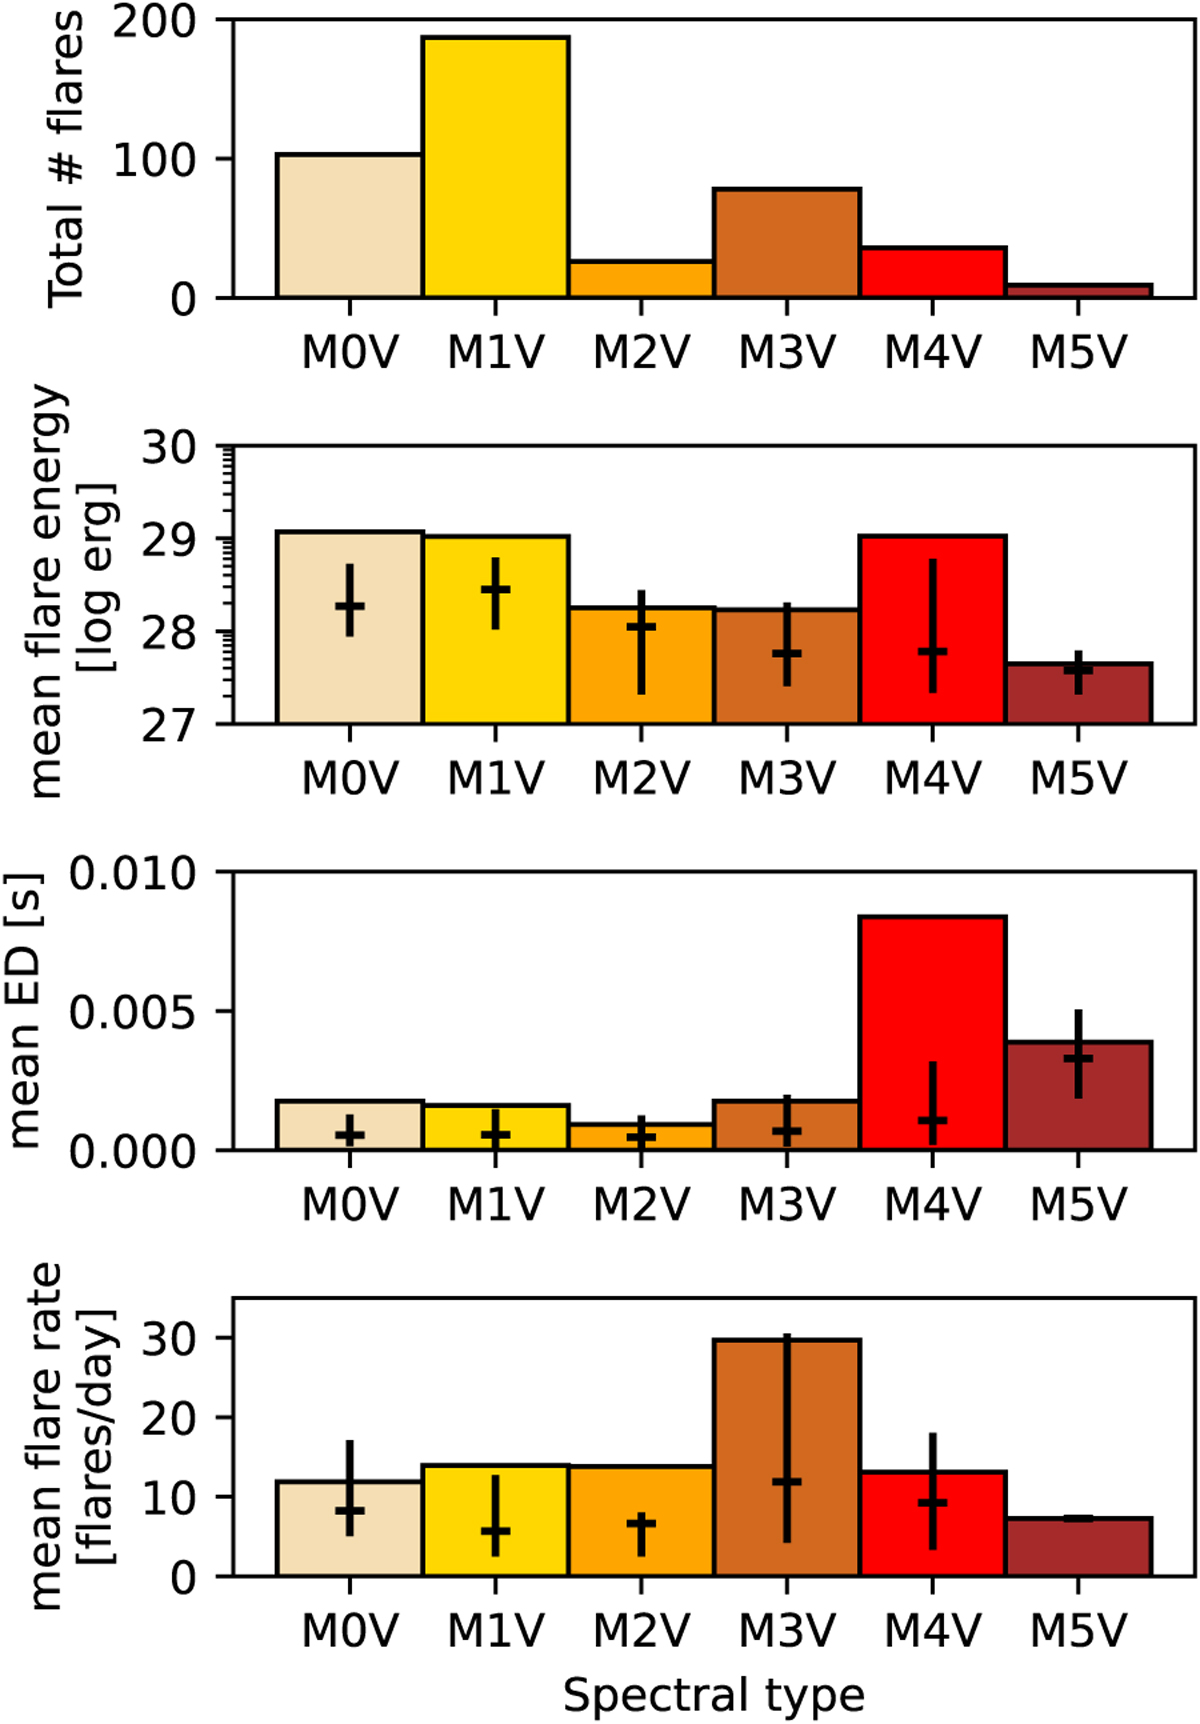
Flare statistics by spectral subtype for the stars in our sample. The top panel shows the mean number of flares per star, the middle panel displays the mean flare energy, and the bottom panel presents the mean flare equivalent duration. Vertical bars represent the interquartile range (1st to 3rd quartiles), while horizontal bars indicate the median values. In the M5V bin of the bottom panel, only one star is included, resulting in equal values for the 1st quartile, median, and 3rd quartile.
Current usage metrics show cumulative count of Article Views (full-text article views including HTML views, PDF and ePub downloads, according to the available data) and Abstracts Views on Vision4Press platform.
Data correspond to usage on the plateform after 2015. The current usage metrics is available 48-96 hours after online publication and is updated daily on week days.
Initial download of the metrics may take a while.