Fig. 15
Download original image
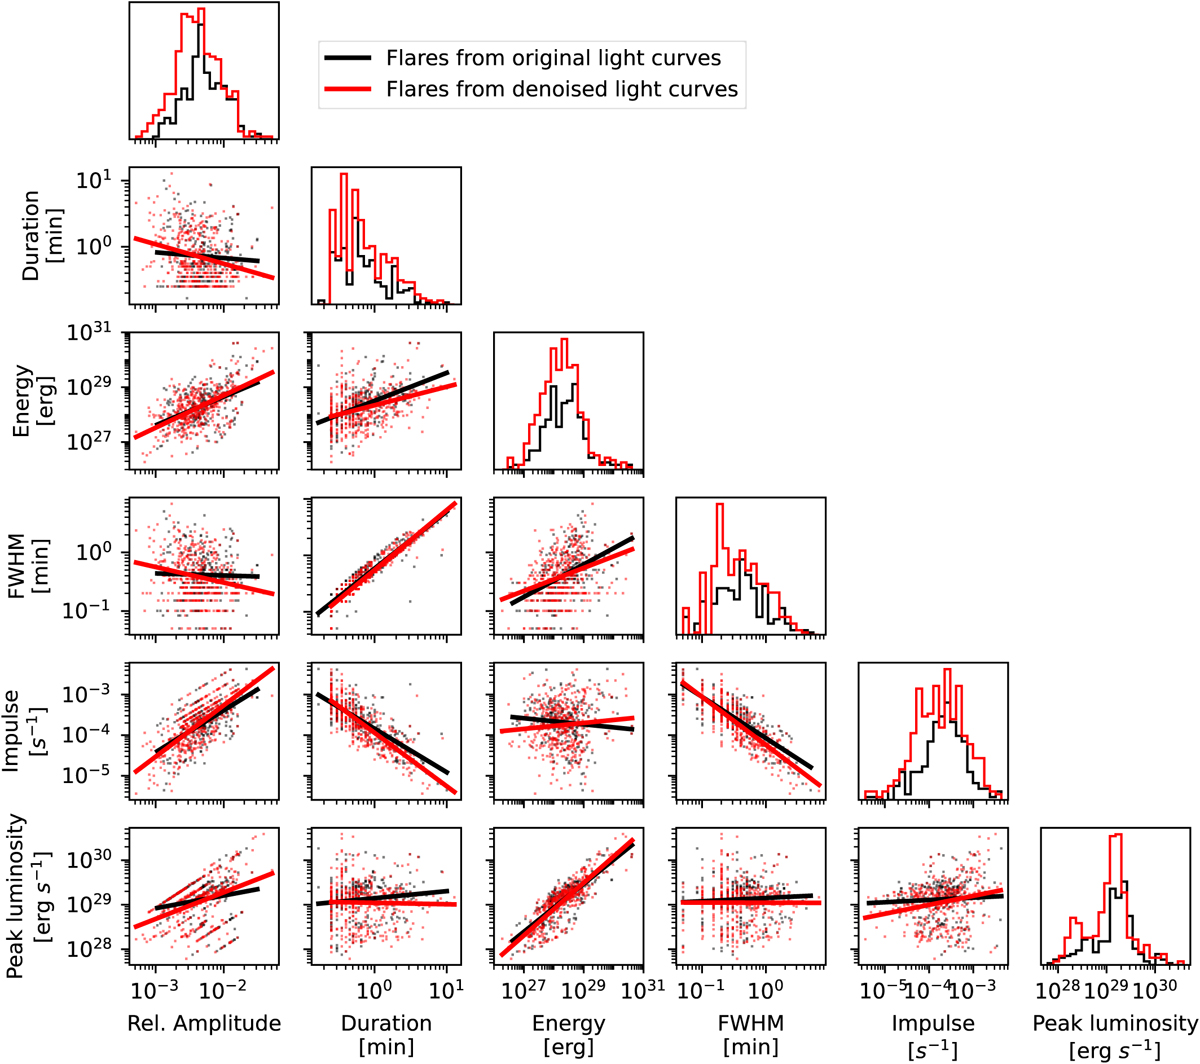
Corner plot of the different flare properties, namely relative amplitude, duration, measured energy, FWHM, impulse, and peak luminosity. The black data points represent metrics of individual flare components detected before denoising, while red data points correspond to those detected after denoising. A linear fit is provided for reference in each distribution. The discrete bins for flare duration and FWHM are due to the observational cadence equal to 3 seconds.
Current usage metrics show cumulative count of Article Views (full-text article views including HTML views, PDF and ePub downloads, according to the available data) and Abstracts Views on Vision4Press platform.
Data correspond to usage on the plateform after 2015. The current usage metrics is available 48-96 hours after online publication and is updated daily on week days.
Initial download of the metrics may take a while.