Fig. 13
Download original image
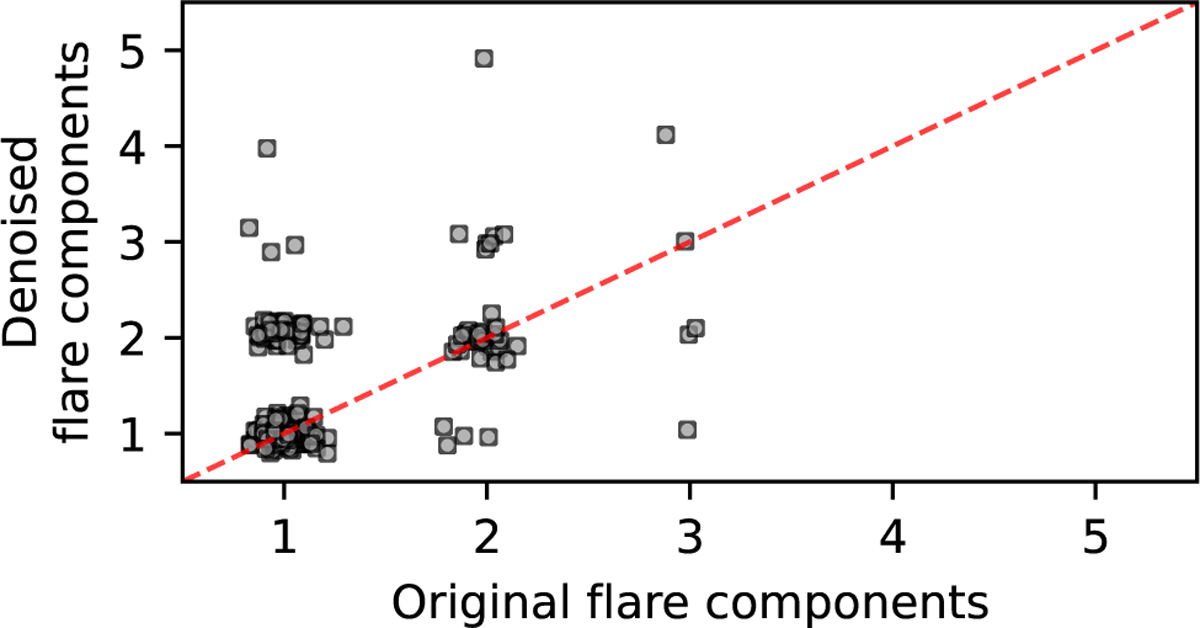
Comparison of the number of peaks detected in each flare before and after denoising. Each point corresponds to a single flare. The red dashed line indicates the 1:1 relation, where the number of peaks remains unchanged. Points above the line represent flares that gained components after denoising, while those below lost components.
Current usage metrics show cumulative count of Article Views (full-text article views including HTML views, PDF and ePub downloads, according to the available data) and Abstracts Views on Vision4Press platform.
Data correspond to usage on the plateform after 2015. The current usage metrics is available 48-96 hours after online publication and is updated daily on week days.
Initial download of the metrics may take a while.