Fig. 10
Download original image
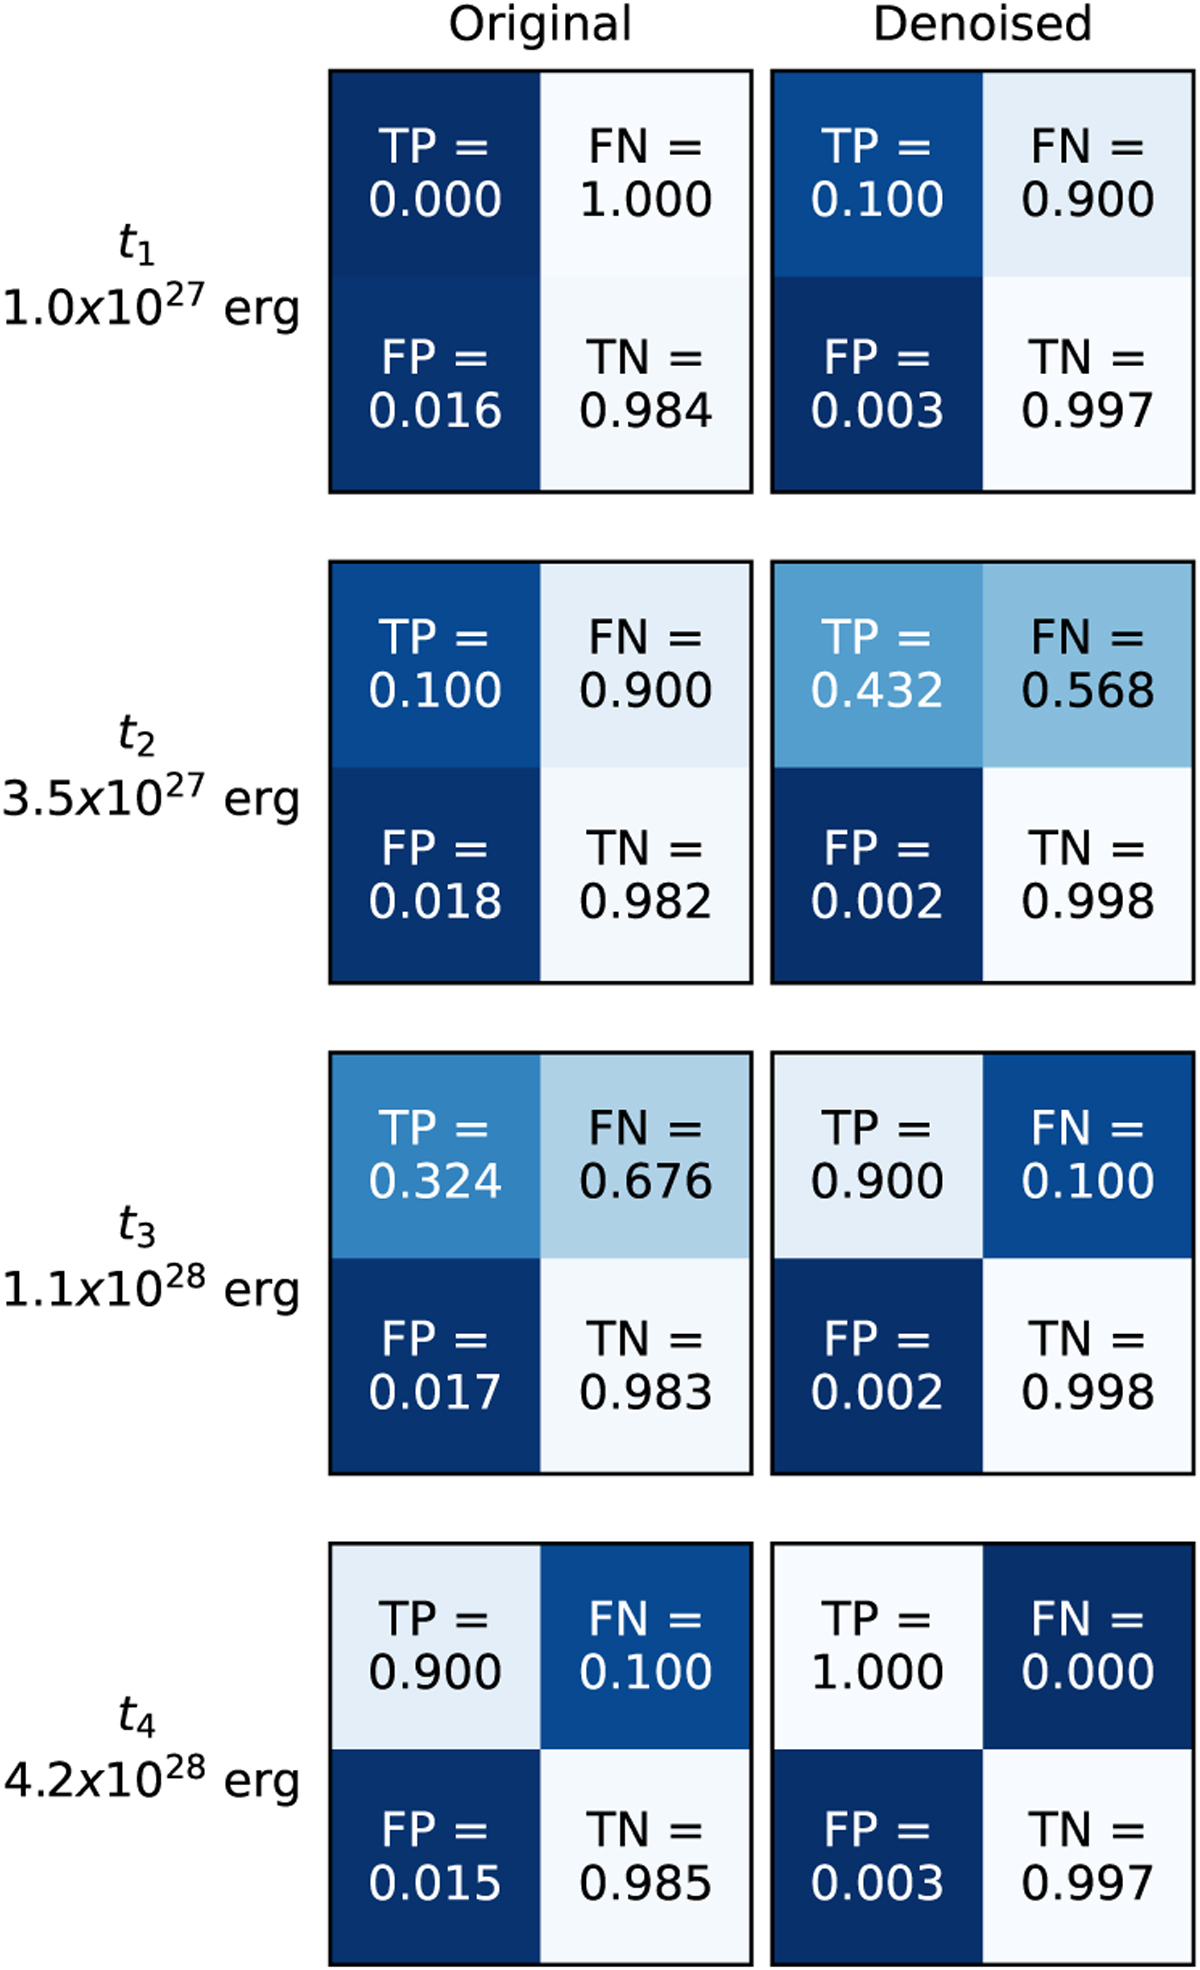
Confusion matrices obtained from the flare injection and recovery process for the original (left) and denoised (right) light curves. The matrices are shown at the four detection thresholds, corresponding to TPR rises above 10% (t1 and t2) and reaching 90% (t3 and t4), as defined in the text.
Current usage metrics show cumulative count of Article Views (full-text article views including HTML views, PDF and ePub downloads, according to the available data) and Abstracts Views on Vision4Press platform.
Data correspond to usage on the plateform after 2015. The current usage metrics is available 48-96 hours after online publication and is updated daily on week days.
Initial download of the metrics may take a while.