Fig. 2.
Download original image
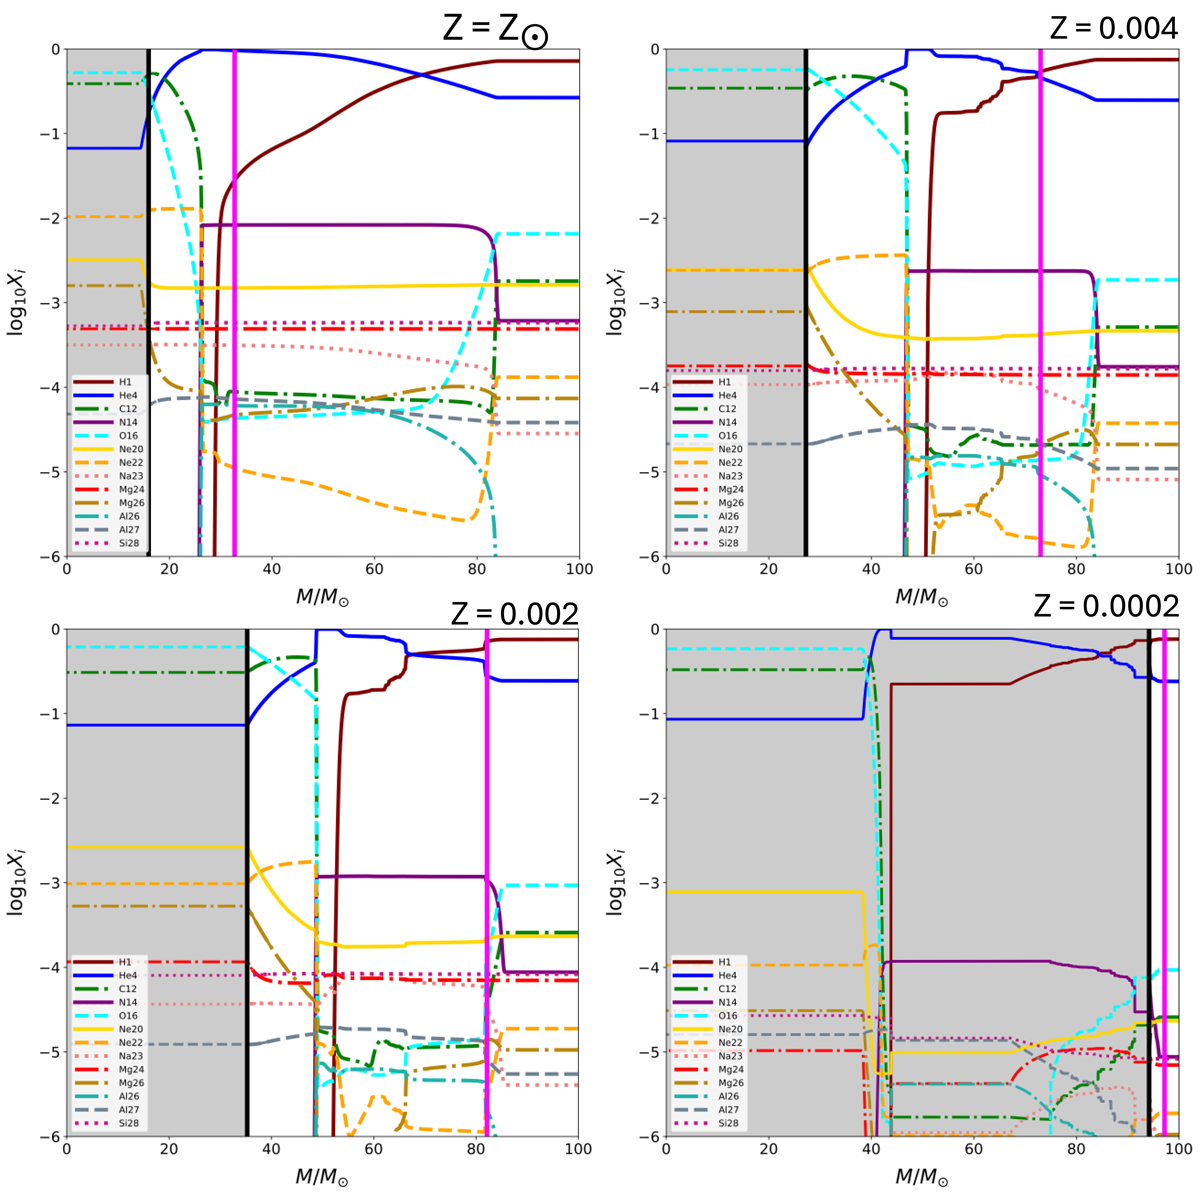
Overview of the chemical composition and its evolution for a 100 M⊙ model calculated from the onset of core H burning until core He exhaustion for Z⊙ (upper left), Z = 0.004 (upper right), Z = 0.002 (lower left), and Z = 0.0002 (lower right). The shaded region illustrates the interior composition at the end of core He burning, while the unshaded region shows the surface abundances of each isotope with time evolving from right to left as mass is lost through winds. The vertical black solid line denotes the end of core He burning, while the vertical magenta solid line shows core H exhaustion.
Current usage metrics show cumulative count of Article Views (full-text article views including HTML views, PDF and ePub downloads, according to the available data) and Abstracts Views on Vision4Press platform.
Data correspond to usage on the plateform after 2015. The current usage metrics is available 48-96 hours after online publication and is updated daily on week days.
Initial download of the metrics may take a while.