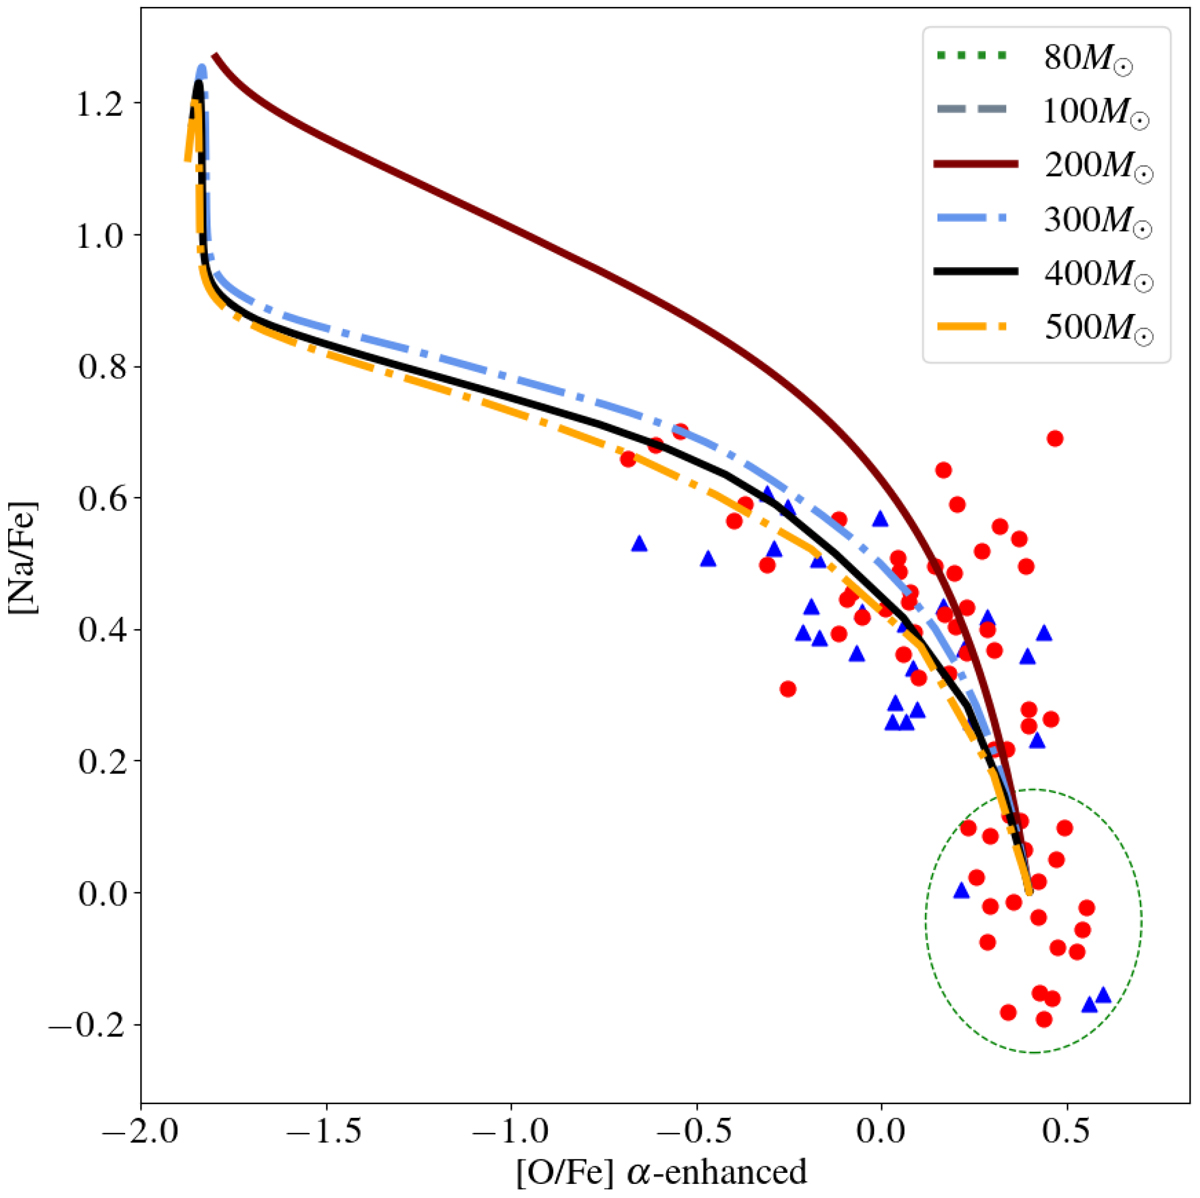
Fig. 11.
Download original image
Surface evolution of [Na/Fe] and [O/Fe] for 80–500 M⊙ models during core H burning at 1/30th Z⊙. The red circles represent detections of stars in NGC 5904, while blue triangles represent upper limits in [O/Fe] as defined by Carretta et al. (2009). The green dashed circle establishes the abundance ratios of field stars ([O/Na] = 0.6), with stars outside of it representing P2 stars.
Current usage metrics show cumulative count of Article Views (full-text article views including HTML views, PDF and ePub downloads, according to the available data) and Abstracts Views on Vision4Press platform.
Data correspond to usage on the plateform after 2015. The current usage metrics is available 48-96 hours after online publication and is updated daily on week days.
Initial download of the metrics may take a while.