Fig. 7
Download original image
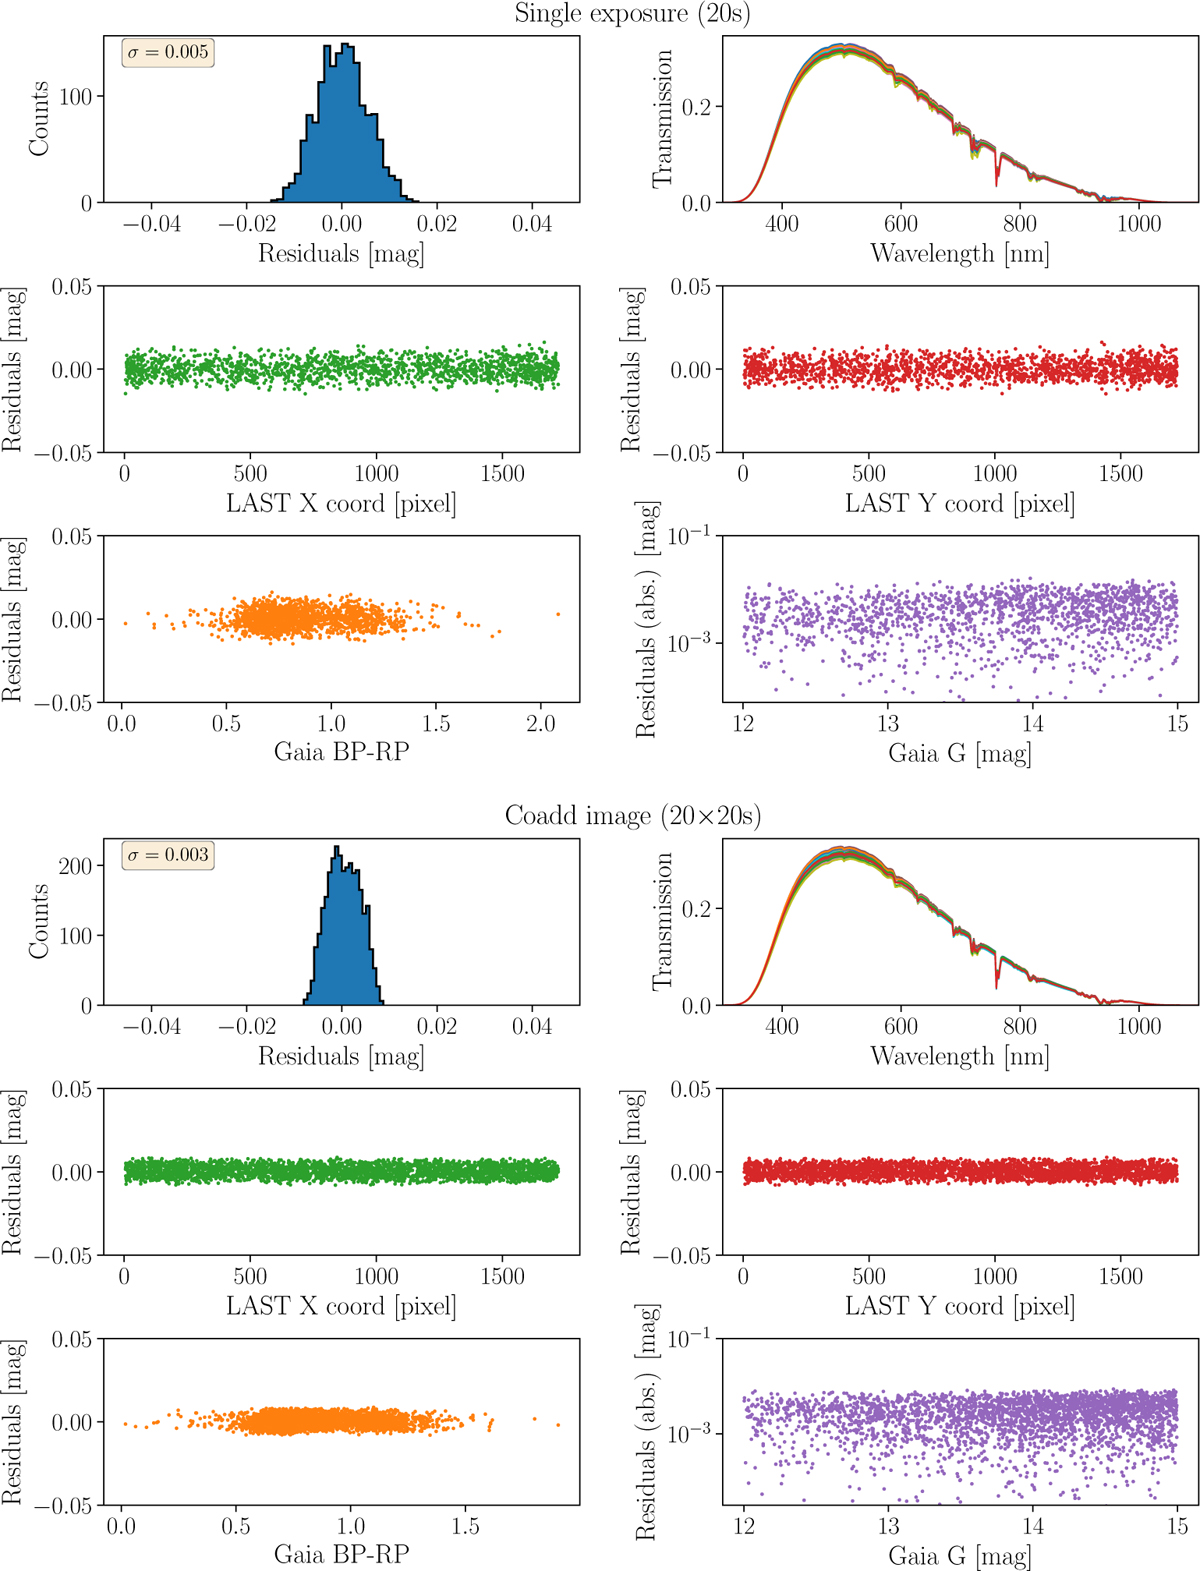
Summary of residual distributions for a single 20 s exposure (top) and for 20×20 s coadded exposures (bottom). The top-left panel shows the overall distribution of the residuals, with the best-fit standard deviation assuming a Gaussian shape. The top right panel shows the 24 transmissions of each sub-image of a single image, fitted independently. The middle panels show the residuals (for all sub-images) as a function of the instrumental coordinates of the camera sensor. The bottom panels show the residuals as a function of the Gaia color (left) and the Gaia G magnitude (right), respectively.
Current usage metrics show cumulative count of Article Views (full-text article views including HTML views, PDF and ePub downloads, according to the available data) and Abstracts Views on Vision4Press platform.
Data correspond to usage on the plateform after 2015. The current usage metrics is available 48-96 hours after online publication and is updated daily on week days.
Initial download of the metrics may take a while.