Open Access
Fig. 4
Download original image
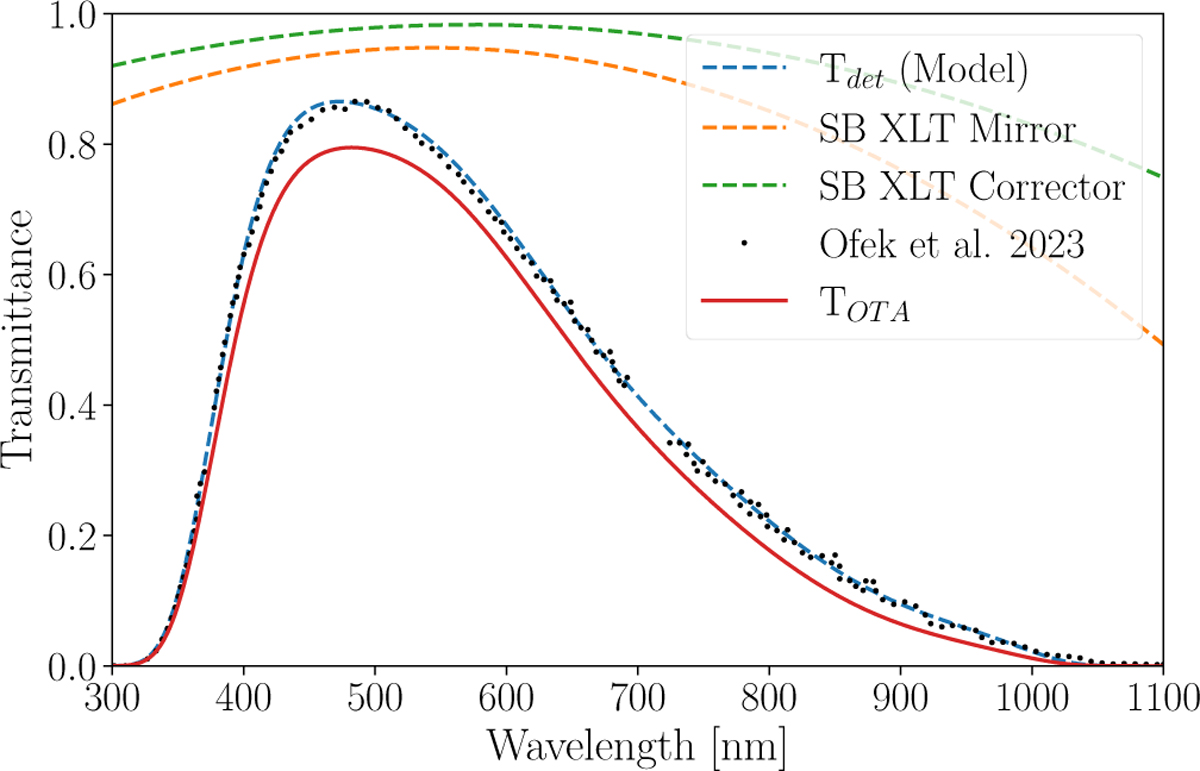
Optical tube assembly instrumental transmission components. The black dots are the laboratory measurements from Ofek et al. 2023a of the QHY600PH QE. The dashed lines show the models of the single instrumental components, while the solid red line shows the total transmission given by the product of the single components.
Current usage metrics show cumulative count of Article Views (full-text article views including HTML views, PDF and ePub downloads, according to the available data) and Abstracts Views on Vision4Press platform.
Data correspond to usage on the plateform after 2015. The current usage metrics is available 48-96 hours after online publication and is updated daily on week days.
Initial download of the metrics may take a while.