Fig. 2
Download original image
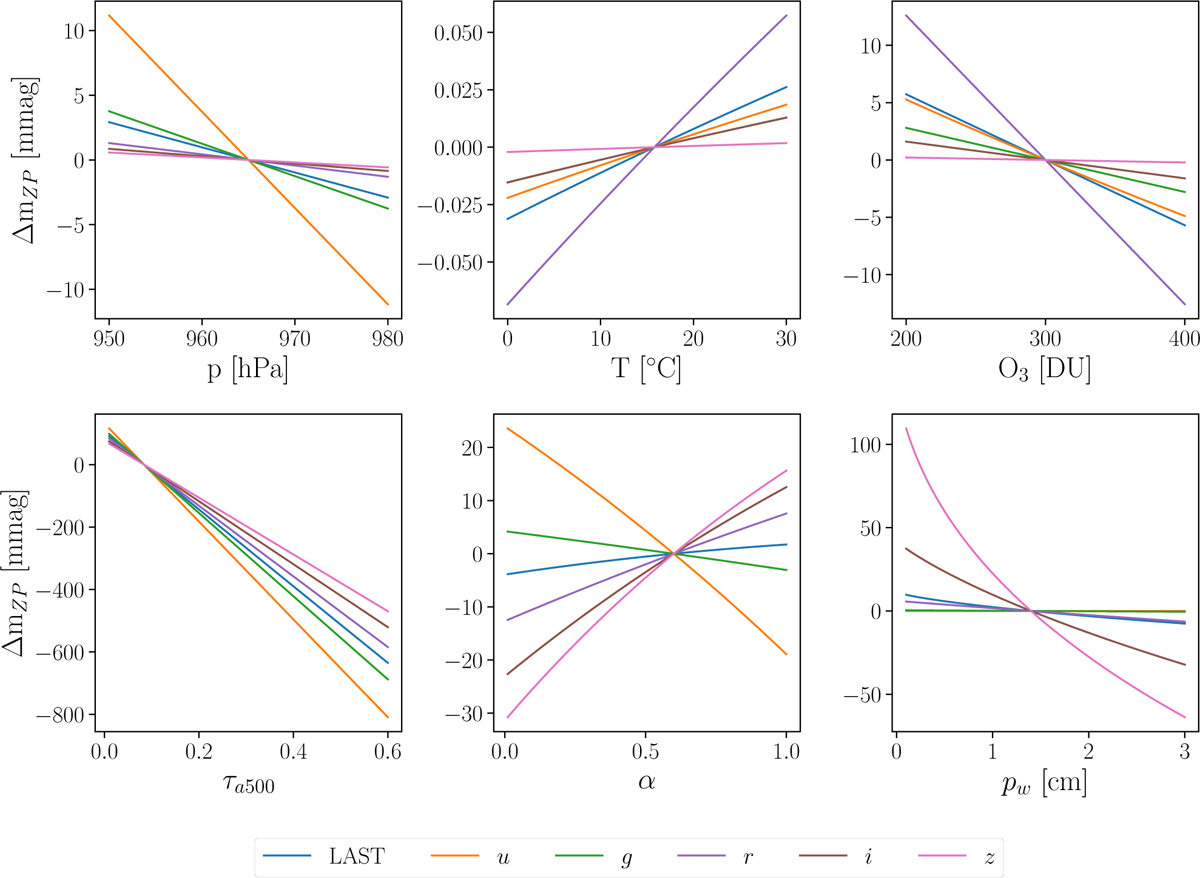
Change in zero point magnitude in selected bands as a function of each atmospheric parameter. The data points are obtained by freeing the atmospheric parameter of interest in the transmission model and calculating the variation of the zero point as a function of the parameter. The reference zero point for each curve is calculated for the atmospheric values in Table 2 and T = 15.8 °C.
Current usage metrics show cumulative count of Article Views (full-text article views including HTML views, PDF and ePub downloads, according to the available data) and Abstracts Views on Vision4Press platform.
Data correspond to usage on the plateform after 2015. The current usage metrics is available 48-96 hours after online publication and is updated daily on week days.
Initial download of the metrics may take a while.