Open Access
Fig. 10
Download original image
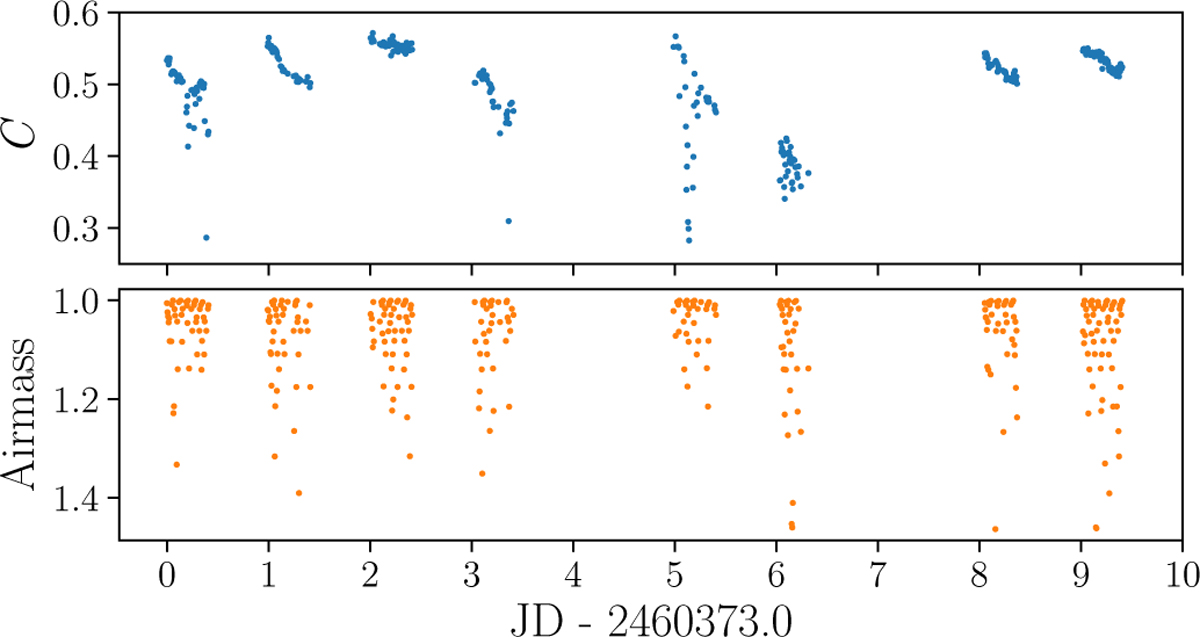
Upper panel: overall normalization parameter for several skysurvey observations obtained during the same nights of the temporal stability study in Sect. 7.2. Each blue point represents the parameter C (from Eq. (20)) for a coadded image. Lower panel: corresponding airmass of each observation (orange points).
Current usage metrics show cumulative count of Article Views (full-text article views including HTML views, PDF and ePub downloads, according to the available data) and Abstracts Views on Vision4Press platform.
Data correspond to usage on the plateform after 2015. The current usage metrics is available 48-96 hours after online publication and is updated daily on week days.
Initial download of the metrics may take a while.