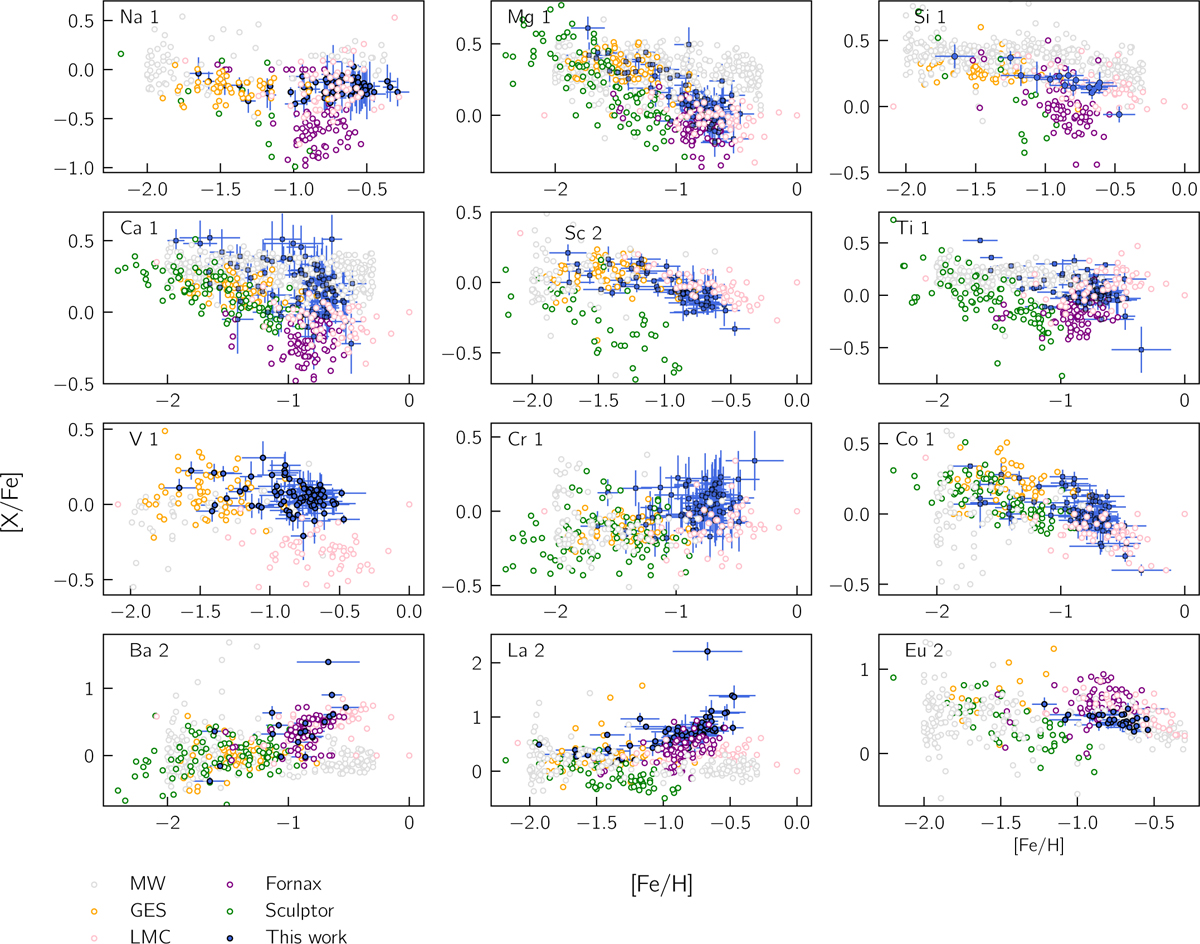
Fig. 10
Download original image
Chemical abundances [X/Fe] as a function of [Fe/H] for the Sgr sample (filled blue dots) are compared with MW halo stars and members of various MW satellites. Specifically, data for the MW halo (empty gray dots) are queried from the SAGA database (Suda et al. 2008). The GES stars (orange) are taken from Carrillo et al. (2022), LMC members (pink) from Van der Swaelmen et al. (2013), and Na measurements from Pompéia et al. (2008). Finally, stars from the Fornax galaxy (purple) are from Letarte et al. (2010), while Sculptor members (green) are from Hill et al. (2019).
Current usage metrics show cumulative count of Article Views (full-text article views including HTML views, PDF and ePub downloads, according to the available data) and Abstracts Views on Vision4Press platform.
Data correspond to usage on the plateform after 2015. The current usage metrics is available 48-96 hours after online publication and is updated daily on week days.
Initial download of the metrics may take a while.