Fig. 8.
Download original image
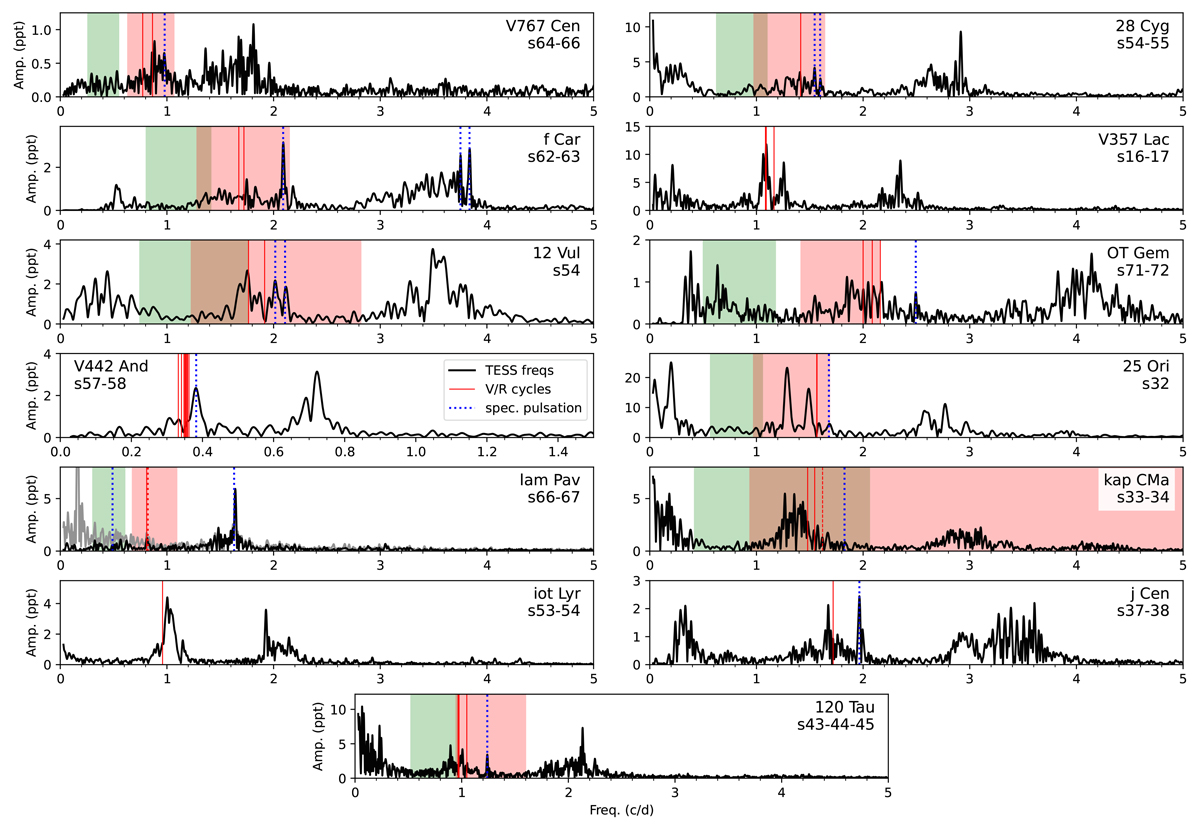
Frequency spectra (black solid curve) from TESS data. The frequencies of the rapid EWV/EWR cycles for these stars are indicated by solid red vertical lines, and spectroscopic pulsational frequencies are indicated by dotted blue vertical lines. The green (red) shaded region is the rotation (orbital) frequency range determined from the parameters of Zorec et al. (2016). The red vertical dotted line for κ CMa is the “secondary frequency” from Rivinius et al. (2003) that may be circumstellar, and likewise for λ Pav from Levenhagen et al. (2011).
Current usage metrics show cumulative count of Article Views (full-text article views including HTML views, PDF and ePub downloads, according to the available data) and Abstracts Views on Vision4Press platform.
Data correspond to usage on the plateform after 2015. The current usage metrics is available 48-96 hours after online publication and is updated daily on week days.
Initial download of the metrics may take a while.