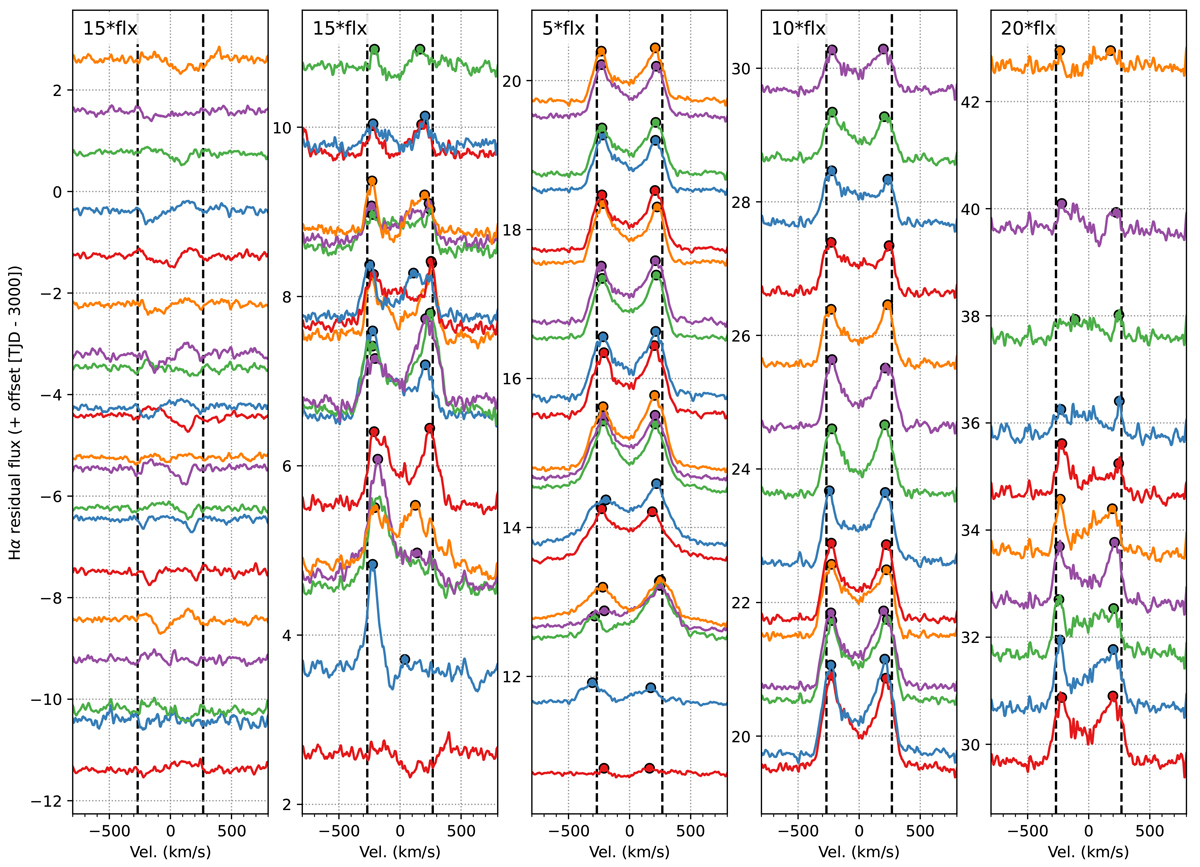
Fig. 6.
Download original image
Emission Hα line profiles for f Car (after subtracting the average observed photospheric line profile) over the full time baseline shown in Fig. 5. In each panel, time increases upward with the y-axis label corresponding to the TJD dates minus 3000 in Fig. 5. In each panel, the flux is scaled by the amount shown in the upper left corner, to make features more visible. The v sin i = 268 km s−1 from Zorec et al. (2016) is indicated by dashed black lines. The first panel is prior to the first flicker, the second panel shows the first smaller flicker, the third shows the first ∼10 days of the next flicker, and the last two panels show the dissipation phase. Solid circles are plotted at the emission peaks, which were used to determine V/R and PS when emission was present.
Current usage metrics show cumulative count of Article Views (full-text article views including HTML views, PDF and ePub downloads, according to the available data) and Abstracts Views on Vision4Press platform.
Data correspond to usage on the plateform after 2015. The current usage metrics is available 48-96 hours after online publication and is updated daily on week days.
Initial download of the metrics may take a while.