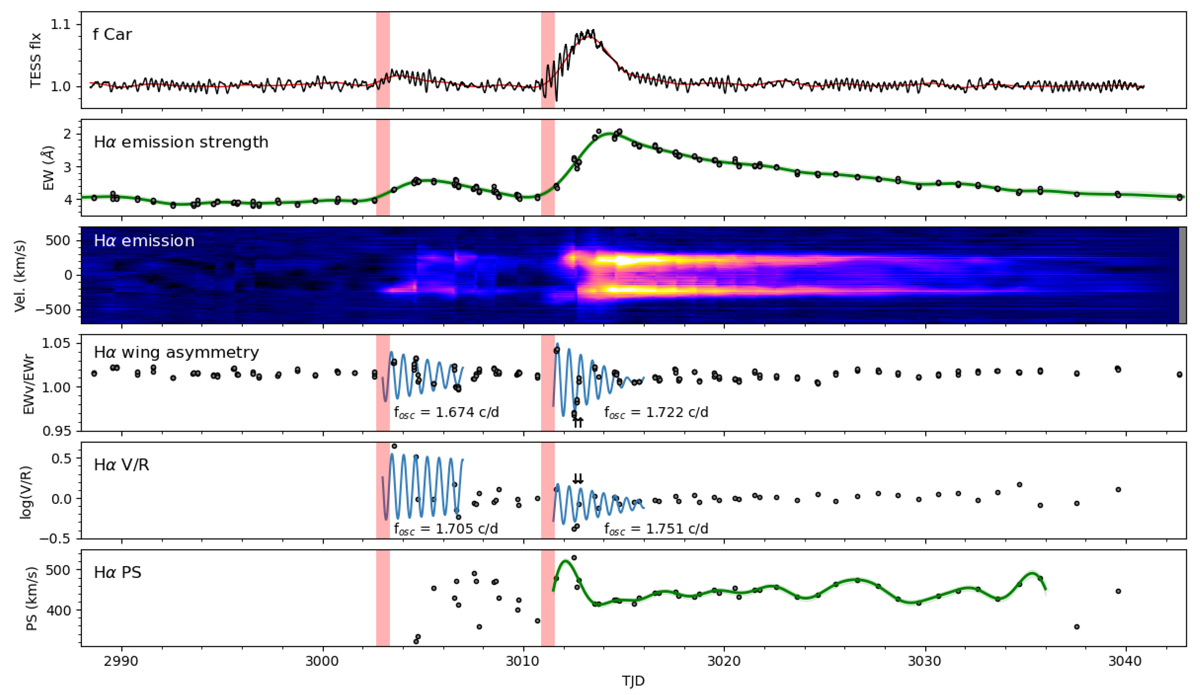
Fig. 5.
Download original image
Observations of the Be star f Car. Panels from top to bottom: TESS light curve (black), Hα EW, dynamical spectrum of Hα emission (after subtracting the photospheric profile), EWV/EWR of Hα, V/R and then peak separation (PS) of Hα emission (with the photospheric profile subtracted). The start of two outburst events are indicated by vertical shaded rectangles. The red curve in the top panel traces the low-frequency signals (below 0.5 d−1). The solid green curve in second and sixth panels are Gaussian Process Regression fits to (sections of) the measurements. The fit of Eq. (2) is plotted for the first few days of the two flickers for EWV/EWR and V/R, with the corresponding frequencies indicated. The two downward arrows near TJD 3013 are the two epochs emphasized in Fig. 2.
Current usage metrics show cumulative count of Article Views (full-text article views including HTML views, PDF and ePub downloads, according to the available data) and Abstracts Views on Vision4Press platform.
Data correspond to usage on the plateform after 2015. The current usage metrics is available 48-96 hours after online publication and is updated daily on week days.
Initial download of the metrics may take a while.