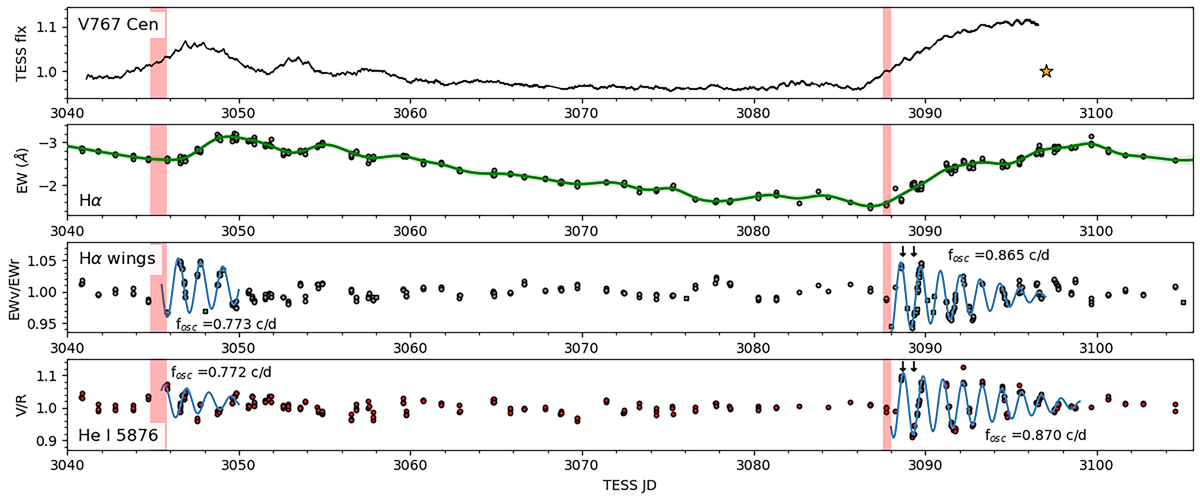
Fig. 4.
Download original image
Observations of the Be star V767 Cen, showing two consecutive sectors of TESS photometry (first panel), Hα EW with a Gaussian process regression (green curve) fit to the data (measured between ±400 km s−1, second panel), Hα EWV/EWR measurements using the emission wings (black circles for professional spectra, green squares for amateur spectra, third panel), and the V/R ratio of the two emission peaks of He I λ5876 (4th panel). The fit of Eq. (2) during the EWV/EWR and V/R oscillations are shown in the bottom two panels, with the corresponding frequency printed. The vertical red bars mark the approximate beginning of two flickers based on the first sign of emission asymmetry. The two arrows near TJD 3089 in the bottom two panels are the two epochs emphasized in Fig. 2. The yellow star in the top panel marks the epoch of the X-ray observation (Appendix E).
Current usage metrics show cumulative count of Article Views (full-text article views including HTML views, PDF and ePub downloads, according to the available data) and Abstracts Views on Vision4Press platform.
Data correspond to usage on the plateform after 2015. The current usage metrics is available 48-96 hours after online publication and is updated daily on week days.
Initial download of the metrics may take a while.