Fig. 3.
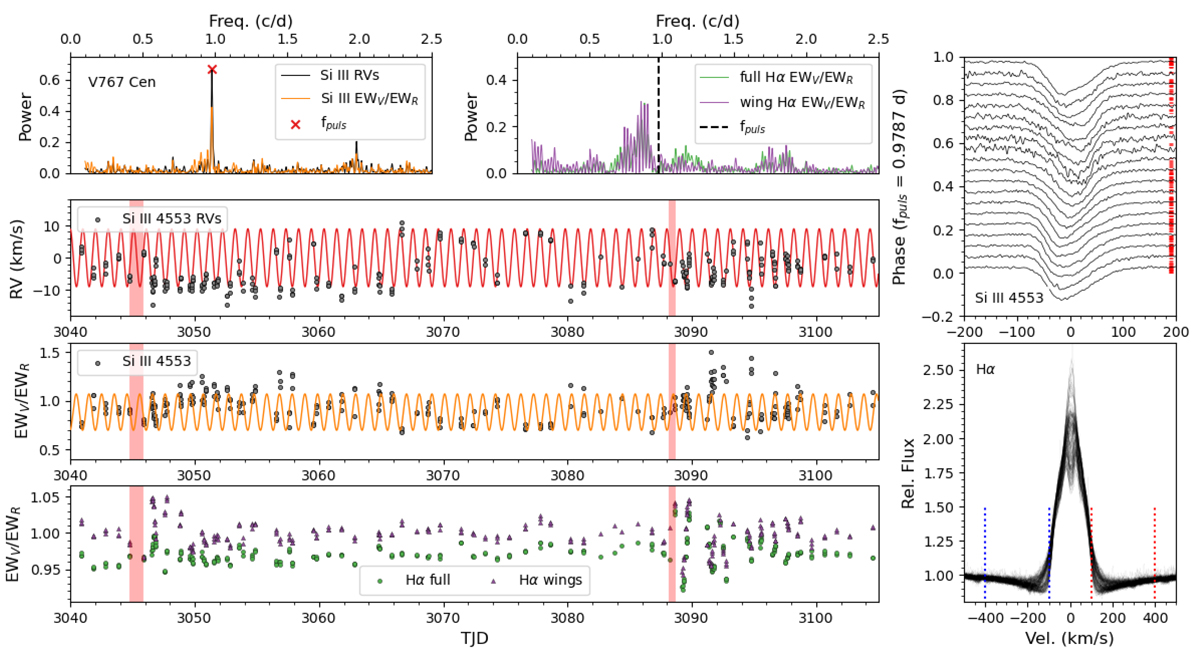
Download original image
Line profiles and measurements of spectroscopic quantities for V767 Cen, illustrating the different character of pulsational variability versus variations in emission features. Top-left panel: Power spectrum determined from measurements of the Si III λ4553 line, with black computed from RV measurements, and orange from the EWV/EWR ratio. The strongest peak, marked with a red “x”, is taken to be the dominant pulsation frequency. Top-middle panel: Power spectrum computed from the Hα EWV/EWR measurements using the full line profile (green) and the high-velocity wings (outside v sin i; purple). Top-right panel: Si III λ4553 line phased to the dominant pulsation period (with 20 bins in phase). Bottom-right panel: Hα line profiles where the inner set of vertical dotted lines mark ±v sin i, and the outer set marks the limits for the EW calculations. Three remaining left panels, from top to bottom: Si III λ4553 RVs, Si III λ4553 EWV/EWR measurements, and Hα EWV/EWR measurements. Both the panels for Si III λ4553 include the best-fit sinusoid at the frequency marked in the top-left panel. The vertical shaded regions in the bottom three left panels indicate the approximate start of the two clearest mass ejection events.
Current usage metrics show cumulative count of Article Views (full-text article views including HTML views, PDF and ePub downloads, according to the available data) and Abstracts Views on Vision4Press platform.
Data correspond to usage on the plateform after 2015. The current usage metrics is available 48-96 hours after online publication and is updated daily on week days.
Initial download of the metrics may take a while.